Tangential and Flow-through Capture of Protein G on NPN
We have long maintained that we can capture more analyte from a sample using a flow-through configuration compared to a tangential configuration. We can confirm this view quantitatively by measuring the amount of material captured on the membrane with equal source flow rates. Additionally, one of the advantages of a silicon-based platform is that we can use silicon-based functionalization chemistries to adhere other molecules to the sensor surface.
This experiment is intended to show the ability of a flow-cell design to improve capture for a basic antibody-based assay. We use a vapor of epichlorohydrin to bind a immunoglobulin G molecule to the surface of the NPN membrane, then flow in Protein G, which is captured by the IGG. To determine the amount of protein captured, we develop a fluorescence measurement from the membrane surface, using an alkaline-phosphatase based reaction with a 4-MUP substrate.
Experimental Details
Chips were obtained from Wafer 1299, 4-slot, 10.9% porosity, 44 nm average pores, 100 nm NPN)
- Piranha clean Chips (3:1 H2SO4:H2O2) (30 minutes)
- Rinse in DI water, N2 gas dry
- 1 ml of epichlorohydrin, vacuum evaporation (2 hrs)
- Vial in warm water bath during evaporation
- Mouse IGG 5 mg/ml in PBS-ET (1x PBS, .05% Tween 20, 5 mM EDTA) (30 min)
- Block with 5% FBS in PBS-ET (30 min)
- Flow Target solution
- Chips were inserted into flow cell
- 1 ug/ml Protein G in PBS-ET
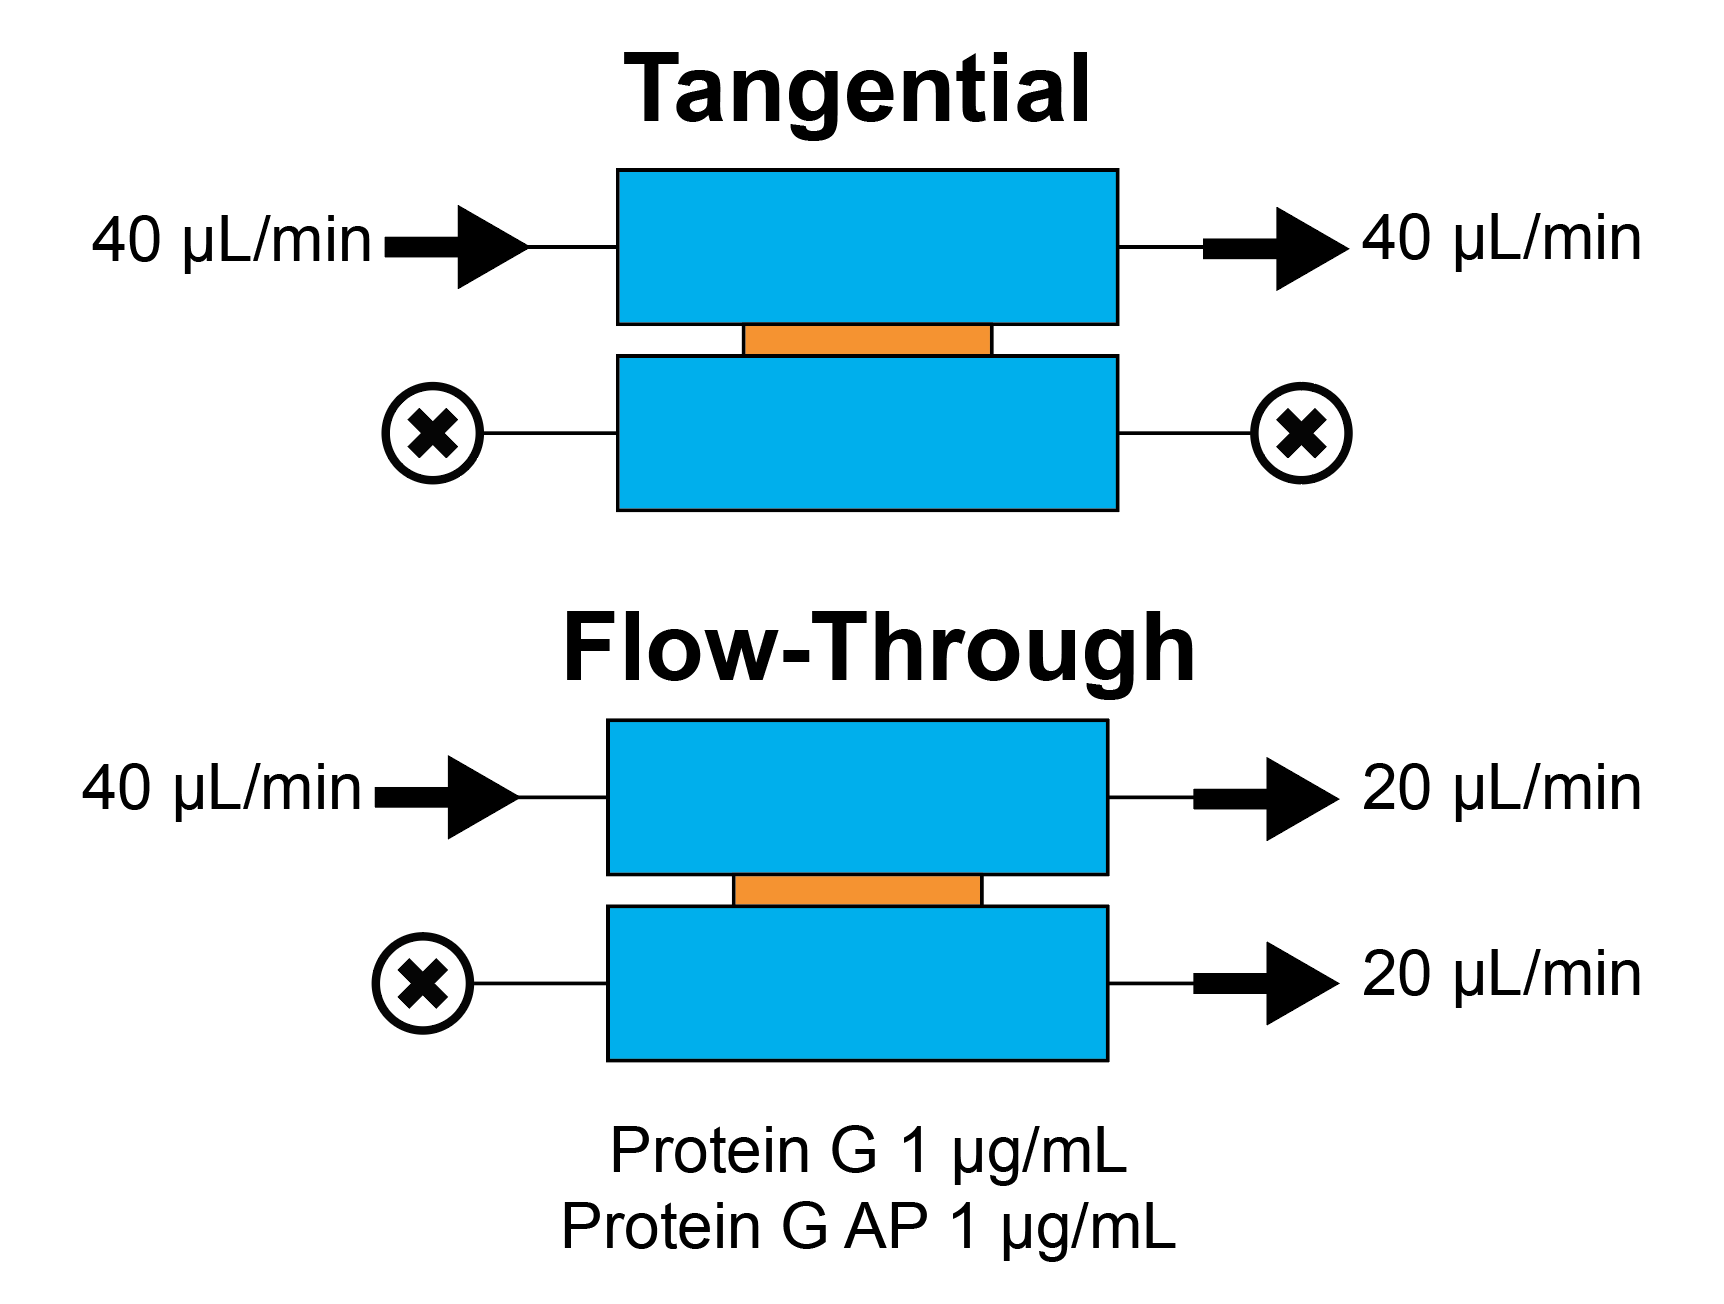
- Tangential (40 ul/min) (30 min)
- Flow-Through (40 ul/min + 20 uL/min)
- 1 ug/ml protein G + Alkaline Phosphatase
- Tangential (40 ul/min) (30 min)
- Flow-Through (40 uL/min + 20 uL/min)
- Wash with PBS-ET (10 min)
- Develop chips in 4-MUP solution (10 mM in 1x Tris HCl, a pH 7.8 buffer solution)
- Measure Fluorescence of developed solution using plate reader (360 nm illumination, 440 nm emission)
Results
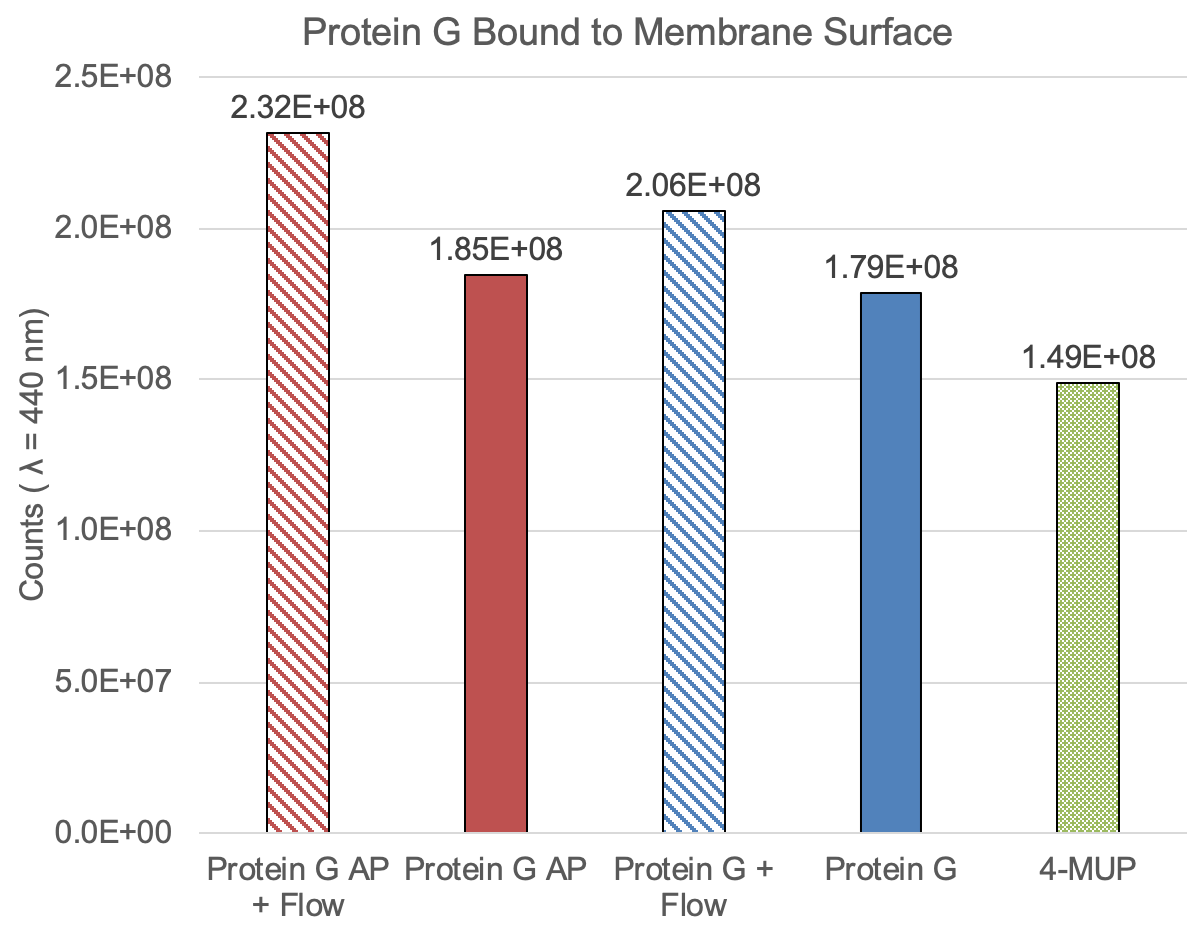
Our first test showed an increase in capture of Protein G across the membrane. The background is high, but we can see an increase in fluorescence for the flow-through treatments over the tangential treatments. The amount of fluorescence in the non-alkaline-phosphatase-containing samples is high; the PBS buffer exposure might be contributing to the measurement. We see an increase in signal for the alkaline phosphatase containing sample compared to the Protein G samples alone, controlling for the type of flow.
I reran this experiment last week to try and get a sense of the error.
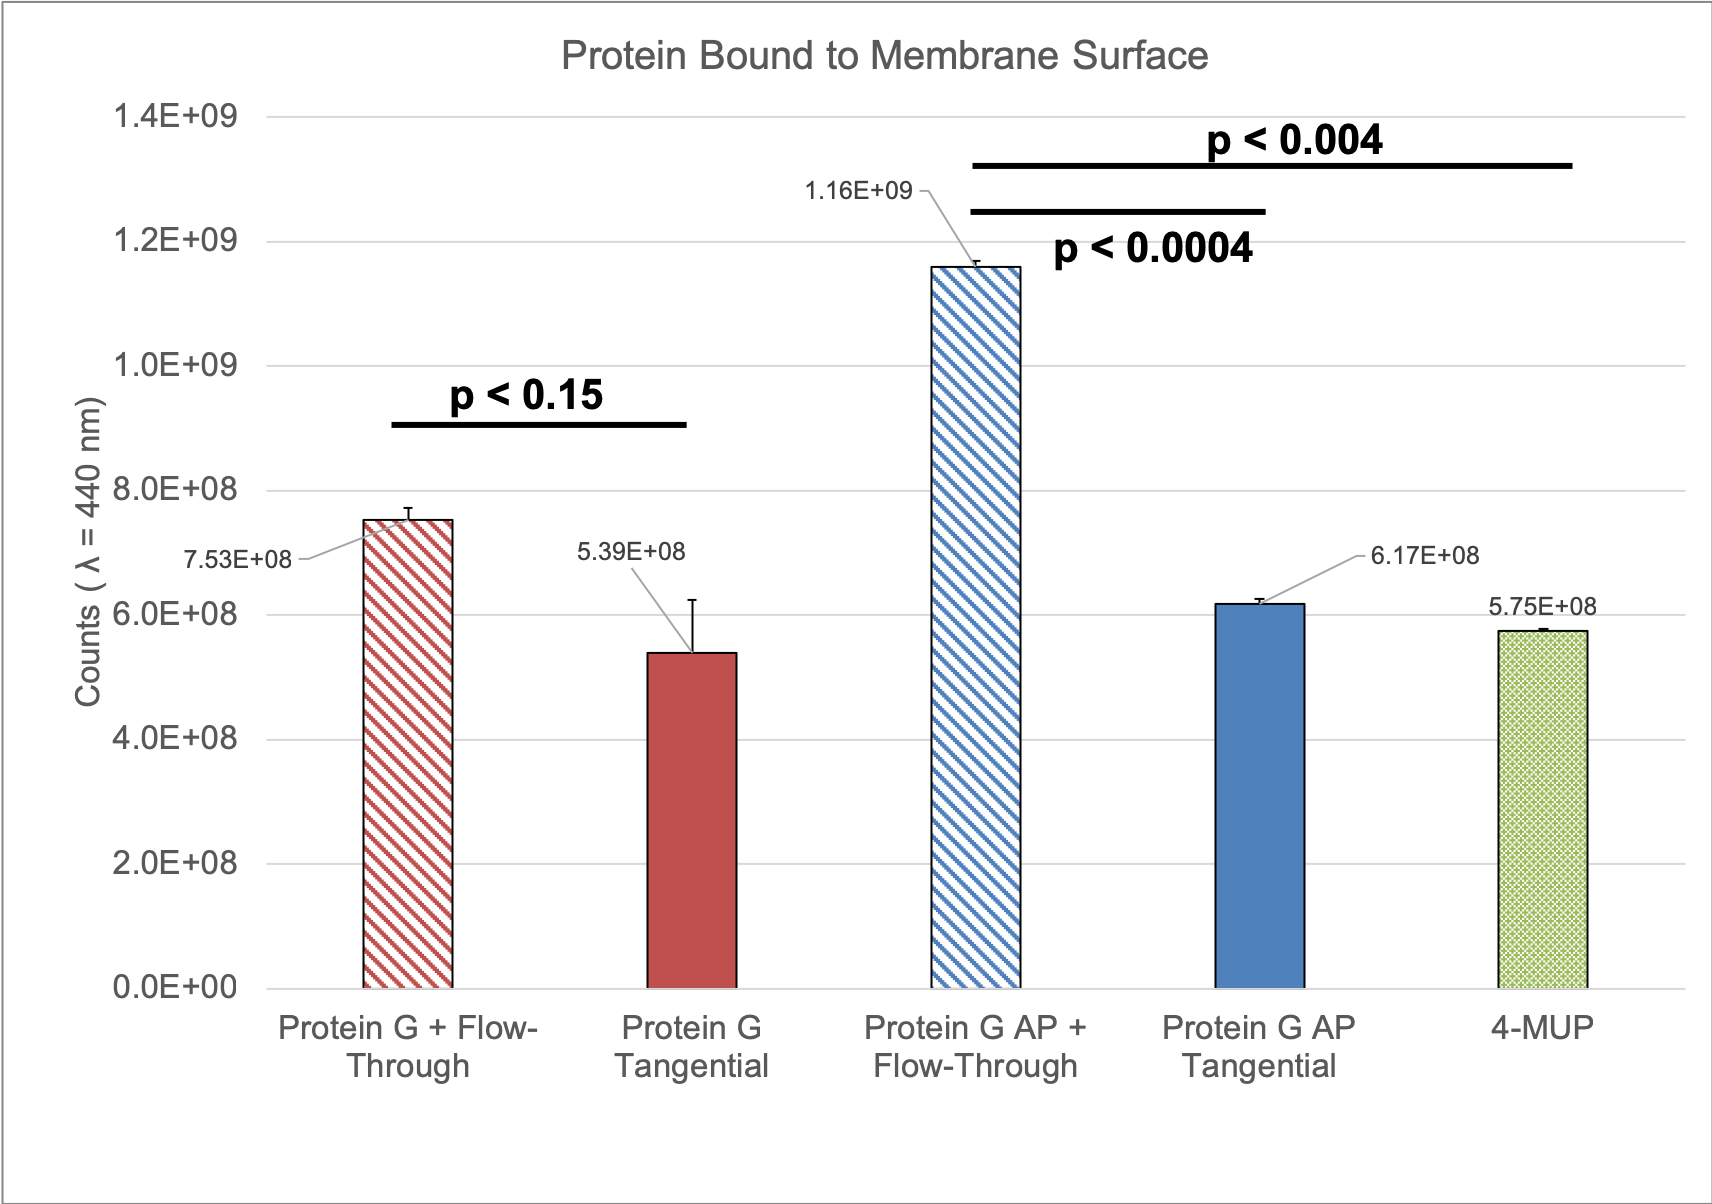
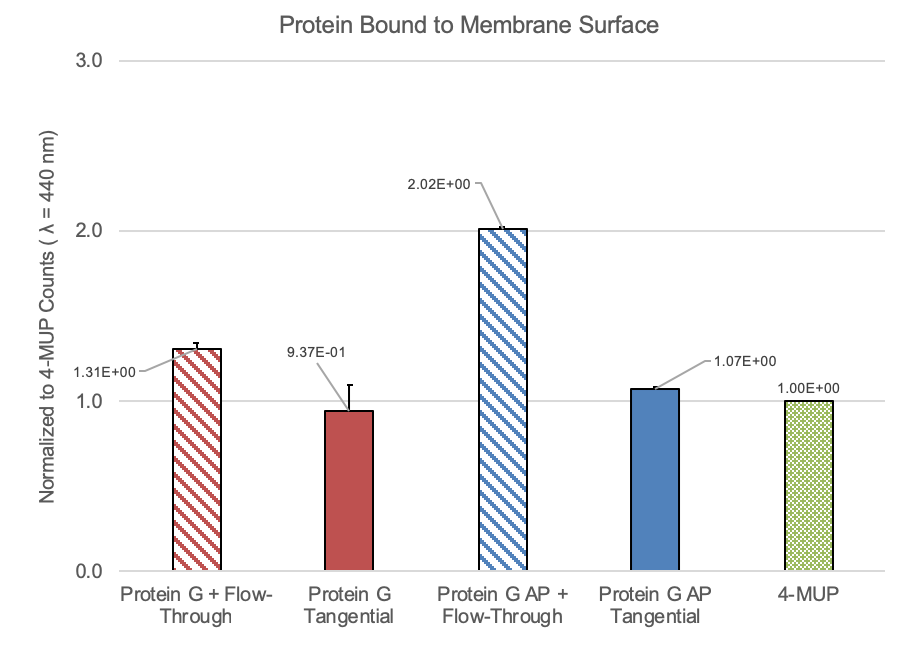
This experiment showed a much stronger 4-MUP signal than I found in January, but the conclusion remained the same. Moving forward, we should try to optimize this protocol by running a number of different concentrations of Protein G and flow rates/ratios.