Filtering Plasma From Whole Blood With Negligible Hemolysis Using Nano Membrane Technology
Background
Hemolysis is the leading cause of unusable laboratory blood samples; accounting for approximately 55% of all unusable samples [1]. Hemolysis can affect lab results by interfering with light absorption of spectroscopic tests, or by releasing analytes into the plasma sample resulting in a false reading [2]. The syringe used to draw blood from a patient and separating plasma from whole blood can result in hemolyzed blood [3]. Limiting the amount of red blood cells that are lyced while filtering plasma from blood is important for the integrity of laboratory tests.
Individuals with chronic kidney disease can develop hyperkalemia; an extremely fatal condition due to excessive concentrations of potassium in the plasma. Hyperkalemia is detected by testing potassium concentrations in plasma samples. Mortality due to hyperkalemia can be reduced if it is treated in a timely fashion. A point-of-care hyperkalemia test is needed to improve the speed of diagnosing patients. Hemolysis is a key issue in this point-of-care test kit. Red blood cells have high concentrations of potassium that are released into the plasma when lysed. The released potassium will cause a false reading when testing for hyperkalemia. It is therefore important to separate plasma from whole blood without lysing red blood cells [4]. A microfluidic device combined with a nanoporous membrane could have the capability to filter plasma from whole blood with minimal hemolysis in a robust, point-of-care test kit.
Materials and Methods
Calibration
Concentration of hemoglobin in the output of the bottom channel was used to determine the degree of lysis during filtration. The Tecan, set to measure absorption at 416 nm, was used to measure the hemoglobin levels of each sample. A calibration curve was created for the Tecan using estimated hemoglobin concentrations. A hematocrit was used to determine the red blood cell count in the whole blood and hemoglobin concentrations were estimated using 35 g/dL per red blood cell. The red blood cells were lysed using a 1:1 ration of triton and aliquoted into hemoglobin concentrations of 0.000308, 0.00154, 0.00308, 0.0154, 0.0308 g/dL. HBSS 1X was used for the dilutions. Figure 1 shows the linear regression for the hemoglobin levels versus the Tecan absorption value.
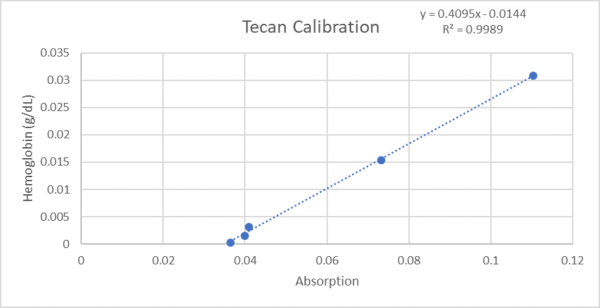
Figure 1. Calibration curve for the Tecan.
Sample Preparation
- 100 µL of lanced whole blood
- 300 µL EDTA (anticoagulant)
- 200 µL HBSS 1X
- 4 ml of HBSS 1X are added to a 4 ml vacutainer containing powdered EDTA.
- Add 300 µL EDTA to a 1.5 ml centrifuge tube.
- Add 100 µL of lanced whole blood to the 300 µL of EDTA to prevent coagulation.
- Add 200 µL of HBSS 1X for greater volume.
Testing
Tests were performed using a two-channel microfluidic device. The top and bottom channels were separated by a membrane composed of 1 X 50 microslits. The top and bottom channels were primed prior to testing with 1X HBSS. Blood solution was gravity fed into the input of the top channel using a 1 mL syringe as shown in Image 1. The top output had a height difference of 6.1 cm from the meniscus of the blood; the bottom output had a difference of 10 cm. These heights give a pressure difference of approximately 382 Pascals across the micromembrane (about 0.055 lb/in^2).

Image 1. Microfluidic device setup full view.
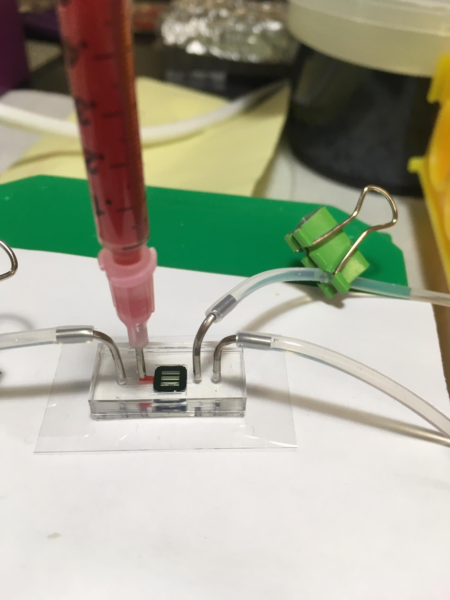
Image 2. Microfluidic device setup close up.

Image 3. Microfluidic device setup during run.
The output samples from the top and bottom were collected in tubes. The bottom (plasma) channel provided approximately 50 µL of sample with a flow rate of about 1.4 µL/s. The top channel had a flow rate of about 15.7 µL/s.
Three wells filled with 2 µL of each sample were added to the nanoquant tray and read with the Tecan. It is important to note that the output sample containing the plasma should be gathered directly from the microfluidic device. To do this, remove all of the tubing from the PDMS and draw 8 µL from the bottom output using a pipet (see appendix for more details).
Results
As a means to avoid diluting the plasma, the sample was extracted directly from the microfluidic device. The collected plasma samples had a red hue visible to the naked eye. Image 4 shows a normal concentration of whole red blood cells in unfiltered blood. Image 5 shows whole red blood cells present in the plasma samples. Comparing images 4 and 5 indicates that a significant number of whole red blood cells are passing through the filter.

Image 4. 10X magnification of unfiltered whole blood in EDTA.
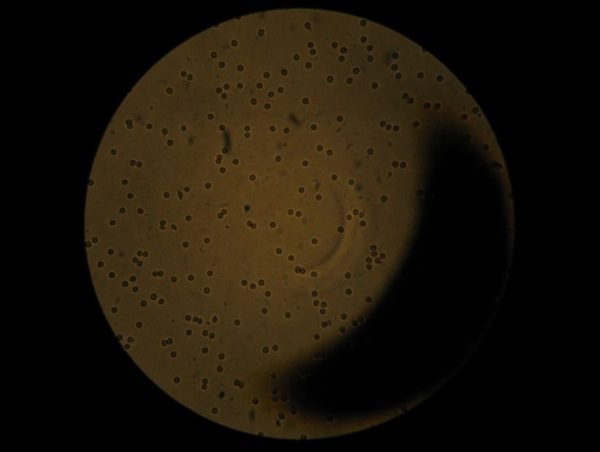
Image 5. 10X magnification of filtered plasma.
Image 6 shows a portion of the top of the filter in a microfluidic device after testing. There is a distinct film of red blood cells covering the filter. Image 7 is a magnification of the filter in image 6. In image 7 the relative size of the 1 X 50 µm slits in the film compared to the size of the red blood cells can be observed. A whole red blood cell can fit through the filter slits.
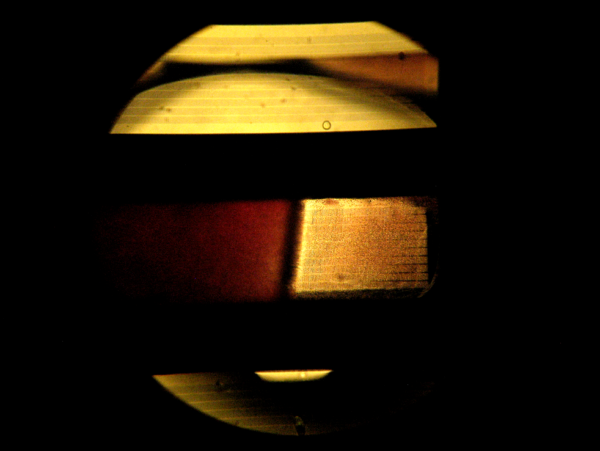
Image 6. 5X magnification of blood in top, center channel of a chip.
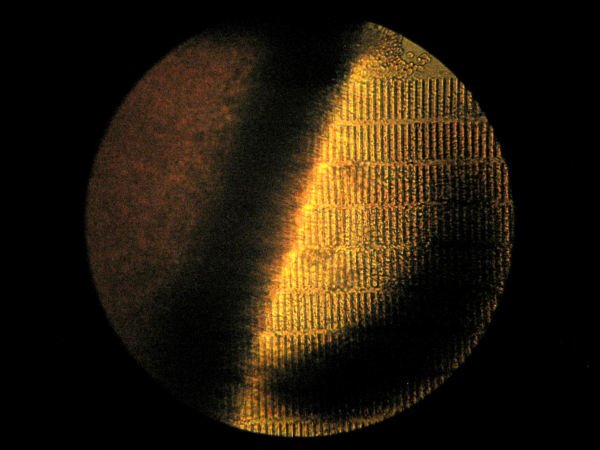
Image 7. 10X magnification of the top of a chip after filtering 100 µL whole blood.
Conclusion
The 1 X 50 µm membrane is too large for filtering out red blood cells. Experimenting using a 0.5 X 50 µm slit membrane in the same microfluidic setup may fix this issue. This should prevent the passage of whole red blood cells from contaminating the sample. With the absence of whole red blood cells, accurate lysis results can be measured in the sample.
Appendix
For a few runs, plasma sample was collected from the tubing connected to the lower output. Figure 2 shows that the plasma samples collected from the tubing appeared to be non-hemolyzed [3]. Figure 2 falsely promises successful test results. It was determined that the HBSS primer in the tubing diluted these samples, providing inconclusive results. Extra care should therefore be taken to ensure that the plasma is not overly diluted by the priming fluid.
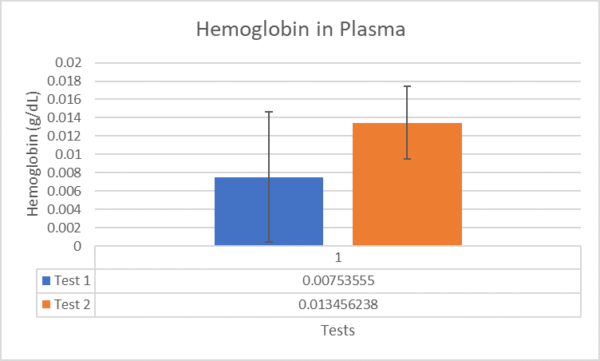
Figure 2. Hemoglobin concentration in test samples taken from tubing.
In figure 3, the same tests as shown in figure 2 are compared to an non-lysed plasma control and a lysed sample control. The lysed control was hemolyzed by pulling the blood through the membrane with a syringe. The lysed control is significantly larger than the non-lysed plasma control with 0.35 g/dL hemoglobin concentration compared to the negligible 0.014 g/dL. However 0.35 g/dL is only mildly hemolyzed, so blood may need to be forced through the microfluidic device at a faster rate in order to achieve severe hemolysis [3].
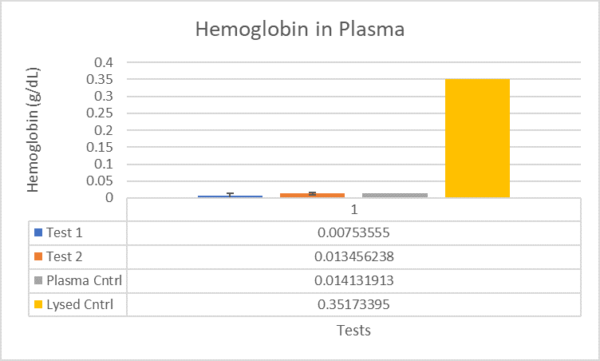
Figure 3. Hemoglobin concentration in test samples compared to controls.
To reduce sample dilution:
- Remove tubing from A and B (outputs)
- Remove tubing from C and D (inputs)
- Extract 8-10 µL from A using a pipet.

***Extracting too much from the bottom channel A may dilute the bottom channel with HBSS from point D, or lyse red blood cells in the top channel and contaminate the sample.***
Video of experiment from beginning to end. Prepared whole blood is passing through top channel of microfluidic device. Pale pinkish hue can be seen on the bottom of the channel.
Sources
[1] G. Lippi et al., “Haemolysis: an overview of the leading cause of unsuitable specimens in clinical laboratories,” Clin. Chem. Lab. Med., vol. 46, no. 6, pp. 764–772, Jan. 2008.
[2] P. J. Howanitz, C. M. Lehman, B. A. Jones, F. A. Meier, and G. L. Horowitz, “Clinical Laboratory Quality Practices When Hemolysis Occurs,” Arch Pathol Lab Med, vol. 139, p. 901, 2015.
[3] M. Koseoglu, A. Hur, A. Atay, and S. Cuhadar, “Effects of hemolysis interference on routine biochemistry parameters,” Biochem. Medica, vol. 21, no. 1, pp. 79–85, Feb. 2011.
[4] J. S. You et al., “Evaluating the utility of rapid point-of-care potassium testing for the early identification of hyperkalemia in patients with chronic kidney disease in the emergency department.,” Yonsei Med. J., vol. 55, no. 5, pp. 1348–53, Sep. 2014.