ADSCs differentiation on porous membranes
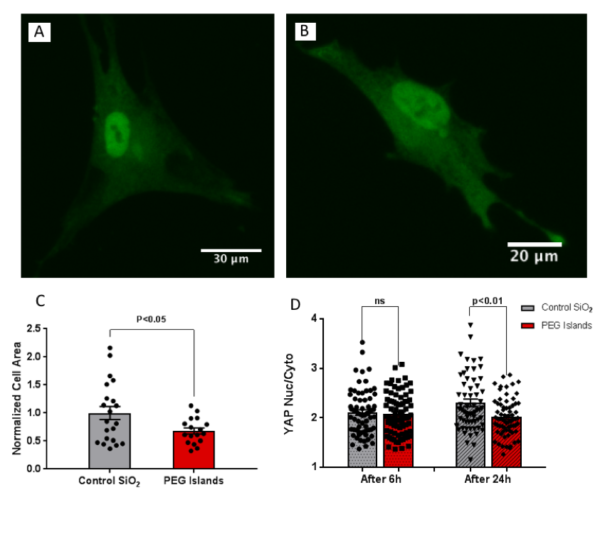
We previously explored cell migration and cell-substrate interactions in the form of altered f-actin polymerization, focal adhesion formation, and fibronectin fibrillogenesis on the discontinuous substrates (porous membranes and non-fouling PEG islands). Here, we were curious about mechano-sensing on these substrates. We first investigated the f-actin polymerization and focal adhesion formation of Adipose-derived stem cells (ADSCs) on the PEG islands, and found similar weakened cell-substrate interaction as our previous studies on this non-fouling patterned substrates. Then, we evaluated YAP localization and cell spreading over these membranes.We observed a significant reduction in spreading area and YAP nuclear localization (after 24 h) on these micro-patterned substrates as compared to control continuous substrates.
Since porous membranes are probably the most broadly applicable disrupted surfaces in cellular studies, we finished our study by evaluating cell spreading and YAP localization on porous membranes with the identical pattern. We found the same trend of reduction in cell spreading and nuclear YAP localization on the porous membrane. A significant reduction in cell spreading as well as reduced YAP nuclear localization after 24 h as compared to the control samples showed that disrupted surface of a rigid substrates such as silicon dioxide can affect mechano-sensing similarly to soft substrates rather than a continuous stiff substrate.

We further aim to investigate the ADSCs differentiation into adipocyte and osteocyte lineage on the porous
membranes and control SiO2 to find out whether the cell fate of mesenchymal cells as the result of mechanosensing on the disrupted rigid substrate is also different from cells over continuous rigid substrate.
First step to evaluate the surface disruption capability to guide the cells toward a specific cell fate is to make sure that our intended stem cells maintained their differentiation capacity. It is stated in the manufacturer website that each vial of their ADSCs have trilineage mesoderm differentiation capacity and can differentiate into adipocytes, osteoblasts and chondrocytes up to 5 passages in MesenPRO RS Medium. However, we first evaluate and confirmed adipogenic and osteogenic capacity of the cells in a set of control test before performing the actual experiments to:
1. Confirm the cells differentiation capacity;
2. Optimizing the staining protocol for simultaneous staining of lipid vacuoles and alkaline phosphatase;
3. Determining the required cell population for this experiment;
1. Confirm the cells differentiation capacity after 8 days (the first day in Mesen pro):
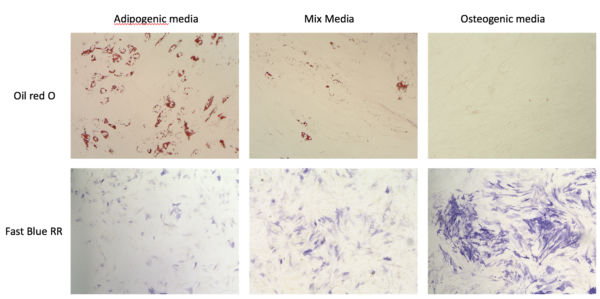
2. Optimizing the staining protocol: Since the staining protocol for this two cell component have different requirements and protocols (including different fixation time), we optimize the protocol to develop proper staining method. Optimized staining protocol: 1-2 min fixation followed by alkaline phosphatase staining, followed by 5 min incubation in IPA, and staining with Oil red O.

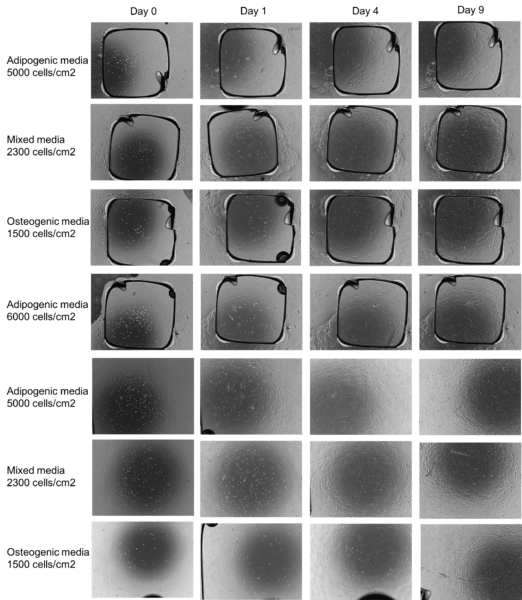
3. Determining the required cell population for this experiment (on SiO2):
Note: Sample size matters for both final population and differentiation:
ADSCs grow very fast in osteogenic media, but they do not grow much in adipogenic media. It was necessary to determine a proper initial cell density that do not lead to the early confluency or low fianl population.
Note: The speed of cell growth is also relatively affected by sample size.
In the next step, we tried the first control tests over SiO2 in different media in after 7 days (Separate staining):
Note 1: Differentiation decreased (but not stopped) in all three conditions was observed (become slower).
Note 2: The images are not normally as clear as TCP samples (especially in higher magnifications):

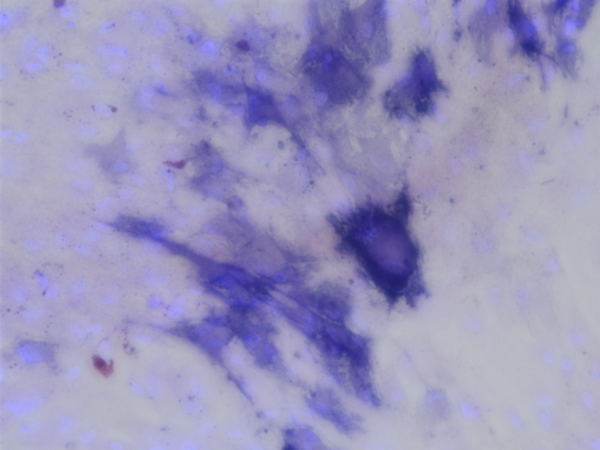
Finally, we started the first run of differentiation experiment on porous membranes:
Note: These samples later are stained with DAPI to enable us to calculate the differentiation ratio.
Since many of the samples broke during the experiment, I finally was left with 3 porous sample (one micron-sized and two sub-micron-sized), which do not let us to conclude based on them. The initial observation showed more alkaline phosphate stained cells on non0porous membranes, and more Oil-red-O stained cells on 0.5 um porous membranes.

Note: These samples later are stained with DAPI to enable us to calculate the differentiation ratio.
Problem 1: Many of the of the non-porous SiO2 samples (which were made by the deposition of SiO2 over glass slides) showed a unclear area in the middle of the samples (my guess is the seperation of the the SiO2 layer from the glass slide).
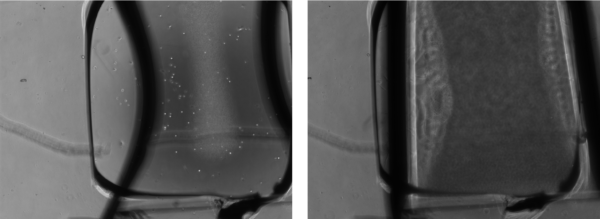
Problem 2: Formation of a tissue like area over some of the SiO2 samples (potentially due to the low cell-substrate interaction).

Future direction: The new sets of experiments on 3um, 0.5um, and non-porous SiO2 will be conducted to have more data points. A little bit lower cell density may be used for this future test. Lower cell density may help with our goal decreasing cell-cell interaction, which in turn can increase cell-substrate interaction.