Theoretical Underpinnings of Small Molecule Permeability Measurements in the µSiM (Part 1: Approach)
NOTE: Some of the ideas in this post are borrowed and rephrased from prior posts by Molly and Alec and our paper Khire et al. 2020. The purpose of this thread is to explain things anew with an eye on application in the R61 project.
Small molecule diffusion from the well to the channel side of the µSiM chamber will be our main method of permeability measurement in the R61 project (A TEER module may be developed at a later date). Instead of end-point assays of dye transport as is conventional for transwells, we’ve been focused on live, in situ measurements of diffusion. In situ measurements would not only be quicker (minutes vs hours), they should not disturb the cellular microenvironment and thus could be repeated several times during on the same culture.
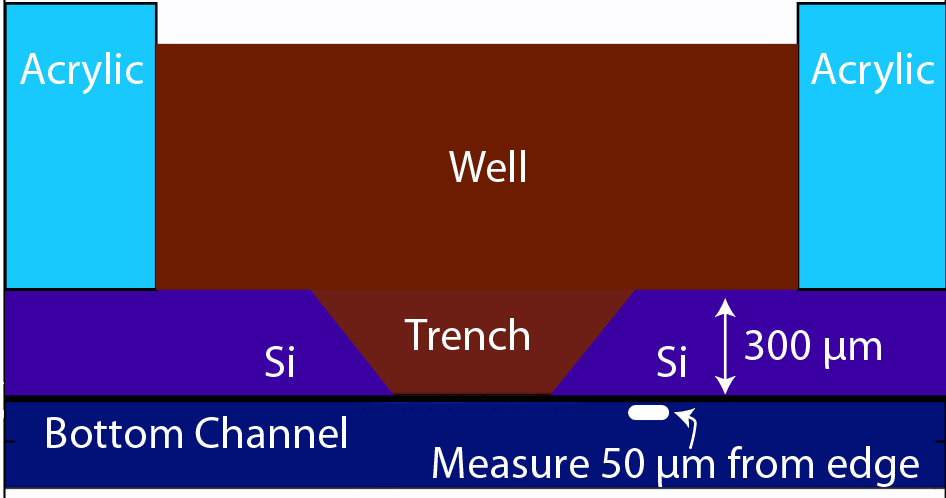
One immediate challenge is that the transparency of our membranes means we cannot make measurements directly beneath the well using standard a epifluorescence microscope: the out-of-plane fluorescence from 100 µL volume containing fluorescent dye in the well overwhelms any measurement in the channel below. For this reason we developed a method to measure fluorescence diffusing “around the corner” where the silicon frame of the membrane chip can block the signal from the well (the method actually dates back to our seminal paper on nanomembranes: Striemer et al., Nature, 2007). To minimize the distance to our measurement we argued in Khire et. al that these measurements should be made in a ‘trench up’ configuration at a distance 50 µm from the membrane edge.
This simulation gives a sense of the expectation for concentration increase over time and the pattern of diffusion from the well into the channel.
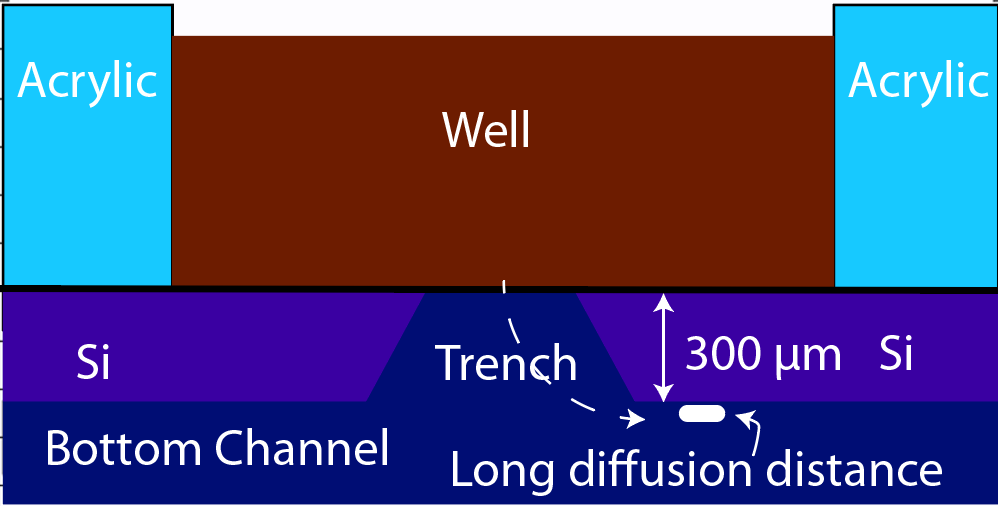
The alternative, trench-down configuration, is undesirable because it adds more than 300 µm to the diffusion distance owing to the thickness of the silicon wafer. It also complicates the path to the measurement site because molecules must first diffuse through the trench to the channel and then laterally to the observation point.
Having selected the method of measurement (trench-down and 50 µm from the membrane edge), we need to a model of the process that we can use to interpret the data. The COMOSL simulations give a reliable model because it accounts for the geometry of our system.
We also examined an analytical solution that assumes simple 1D diffusion from an inexhaustible source:
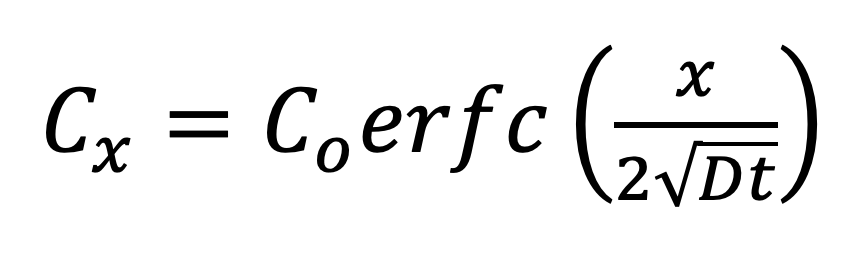
Here Cx and Co are the local and well concentrations respectively, D is the diffusion coefficient of the molecule, t is time, and x is the distance of measurement from the source. An analytical model has the obvious benefit that anyone can simply fit data to the model without access to COMSOL.
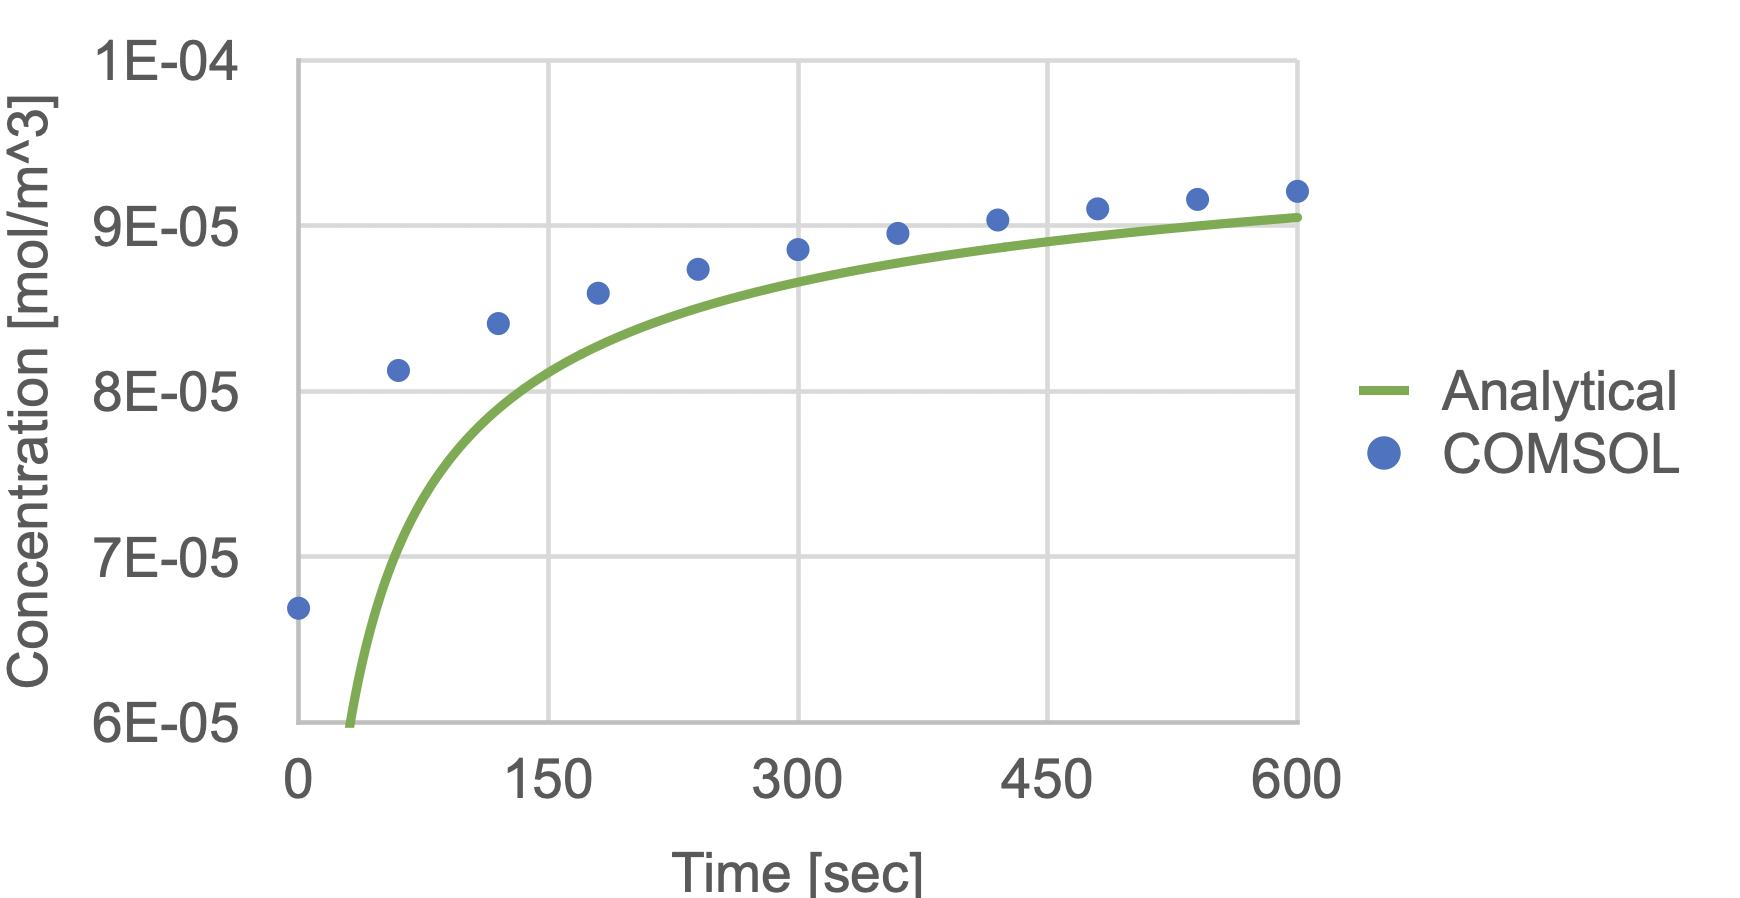
Not surprisingly, we found the analytical model and COMSOL model did not agree when we used the same value for D in both models and measured the concentration rise at a 50 µm location from the membrane edge in the channel. We tried several values of ‘x’ in the analytical model ranging between 50 microns and the mid-point of the membrane, so between 50 µm and 400 µm (i.e. 350 µm + 50 µm), but none worked. The assumption of 1-D diffusion simply doesn’t apply to our situation.
For this reason Khire et al. goes on to propose that the COMSOL simulations should be used to generate ‘look-up tables’ that can then be used to fit experimental data to determine permeability values. This is complicated, but we do go on to validate the method using a limited number of cellular studies and favorable comparisons to end-point permeability assays using Transwells.
Now several things have changed since we did the work for Khire et al. First, the R61 project compels us to revisit permeability measurements that will work for the trench-down configuration. We prefer the simplicity of seeding on the flat side of the membrane, the appearance of the EC monolayer in the trenchdown configuration, and the nice parallel streamlines across flat chip surface during flow. Trench-down also avoids leukocytes entering the trench because we know from experience that the trench can act as a funnel to collect cells on the membrane.
Second, we acquired a spinning disk confocal (Andor Dragonfly) which should allow us (at least at UR) to minimize out-of-plane fluorescence contributions from the well and make measurements under the membranes and inside the trench. Others with spinning disk or two-photon microscopes might be able to do the same. Alternatively a spot measurement in a laser scanning confocal might do this and still avoid bleaching.
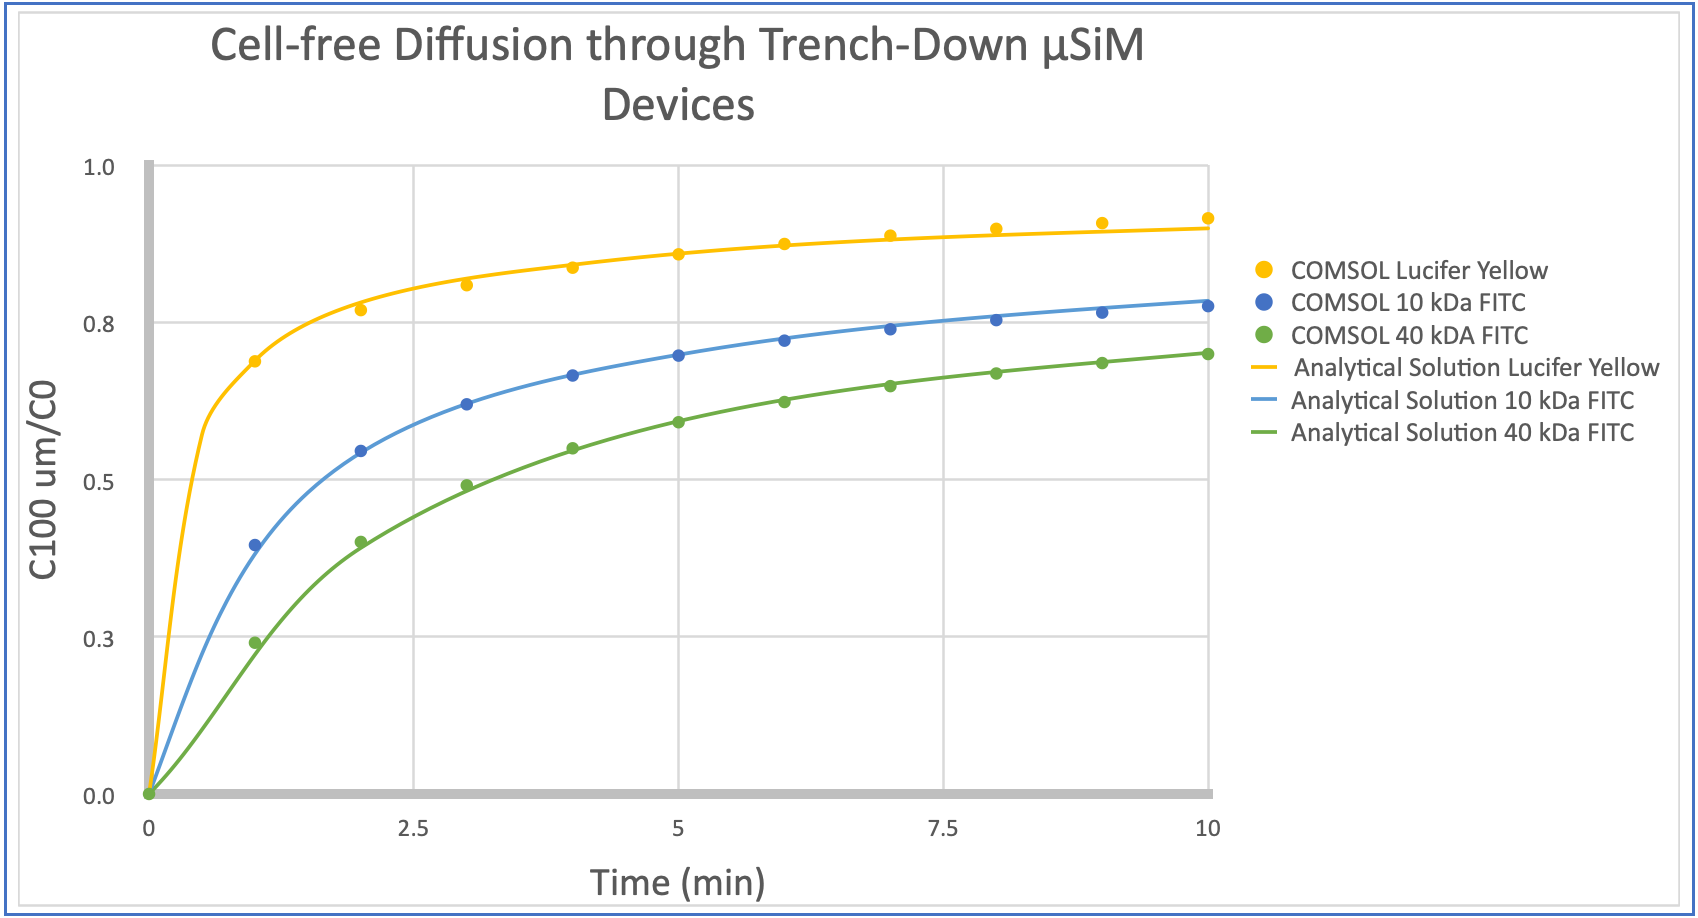
Our first installment on this topic simply re-examines the utility of the 1D analytical model for a measurement at the center of the membrane 100 µm into the trench. We checked this by comparing the 1D analytical to the COMSOL model at 100 µm below the membrane for a number of differently sized molecules (with diffusion coefficients calculated by estimating the hydraulic radius and using Stokes-Einstein). Results show excellent agreement. Thus diffusion along the membrane centerline is 1D and provides the most straightforward opportunity for interpreting permeability measurements.
In forthcoming posts on this topic, we will validate this method experimentally and talk about the inclusion of cells and the calculation of monolayer permeability from real (and simulated) data. We will also discuss sampling approaches to measuring permeability in the µSiM as this will be the alternative for many without convenient access to confocal microscopy. Note that end-point sampling has been done in both Mossu et al., 2019 and Hudcez et al., 2020 with success. Additionally, small volume digital sampling, which we hope to access through the tools being developed in Katsuo Kurabayashi’s lab at Michigan, should be useful for permeability studies in addition to their intended use for cytokine measurements. Like in situ measurements, small volume digital sampling should give us a way of making concentration measurements with a minimal disturbance of the microenvironment.