Pore vs. charge separations
This is a draft of a figure I think I’d like to use in my upcoming paper about charge based separations (this paper will include the Bernhard data). I thought I’d post it here first to get some feedback. I’ll first discuss the figure and then outline the problems that I see.
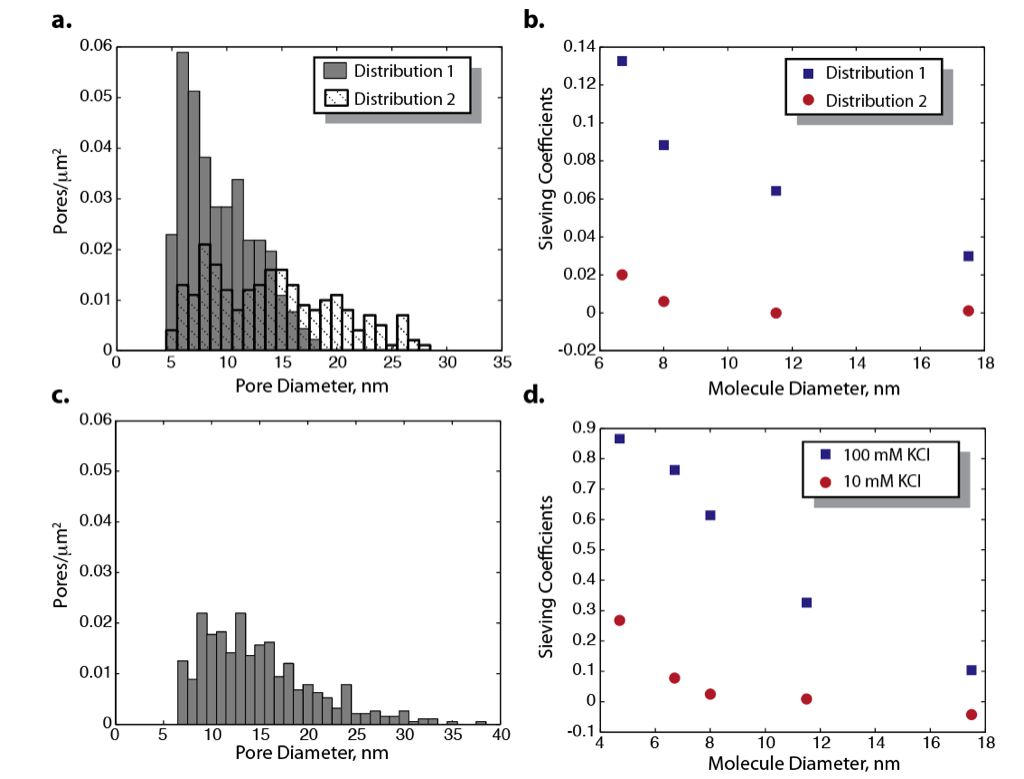
Panel a. shows the pore distributions of two membranes used to perform size based separations of a protein mixture in 1x PBS (150mM salts). One membrane has a higher cutoff and higher porosity due to the larger pores (28nm cutoff, ~4% porosity). The other membrane has a lower cutoff, more smaller pores, and a lower overall porosity (19 nm cutoff, ~2% porosity). In b. we see the results of two separations performed with these two membranes (error bars have not yet made it to this version of the figure, but stats do exist). The sieving coefficients show that the separation using the larger pored membrane has progressed further than the smaller pored membrane.
In panel c. we see the sole membrane used for the charge based separations (cutoff 37 nm, 4.5% porosity). In panel d. two separations are performed at different salt concentrations with the same membrane. The idea is that we can get a similar change in the sieving coefficients just by turning the “salt” knob and changing the amount of electrostatic shielding on the membrane.
So I do like this figure in theory, but there are some problems that may keep me from publishing it. Most concern the fact that the size based separations are really old data performed using a slightly different method.
Problems:
1. The old gel was silver stained, meaning densitometry is not as good as coomassie data and I had to drop one of the points because there was some nouniformity there (this is why there is one less point in b.).
2. The setup for the old system has dilution issues that may mean we cannot compare directly to the new data. The old setup was 3uL on top of membrane, 60uL below. The top was diluted 20x to reach the same volume. This will skew the sieving coefficients, however we still see a trend in sieving coefficients that I believe to be reasonable.
3. The sieving coefficients are lower in the b. as compared to d. This may be due to the above 2 problems.
4. There is a porosity difference between the two membranes that may account for some of the sieving difference.
5. We can’t just fit exponential curves to these sieving data points. We’d have to take into account free diffusion effects and fit this to my model. That is doable, but we haven’t yet added salt explicitly to the model.
Those are most of my concerns. I do like how this comes out and it goes well with the DNA and nanoparticle separations in this paper. To redo experiments from panel a. and b. would require new circular sepcon membranes with two different pore distribution, which would create a significant time delay in getting this out. So what are people’s thoughts?
I like the figure. The big difference between the sieving coefficients in the two panels is my biggest hang-up.
Did you flip the labels somewhere? It looks to me that distribution 1 has higher sieving coefficients (more material in the filtrate) but this is the smaller pore membrane.
2 – Can’t we correct the sieving coefficients?
4 – I don’t think the 2% vs 4% porosity difference will impact the rate of transport much. Can’t we argue this concern away?
You’re right, that’s my mistake. The distribution with the largest pores has the highest sieving coefficient. I mixed up the labels there.
My concern with the sieving coefficients is that the ones for the movable separations are much lower than the charge separations. I think this is due to the gel types.
Is there are reason to not include the total % porosity in panels A and C?
No reason, it just didn’t make the cut on this particular draft. It’s something that could probably appear in the legend too.