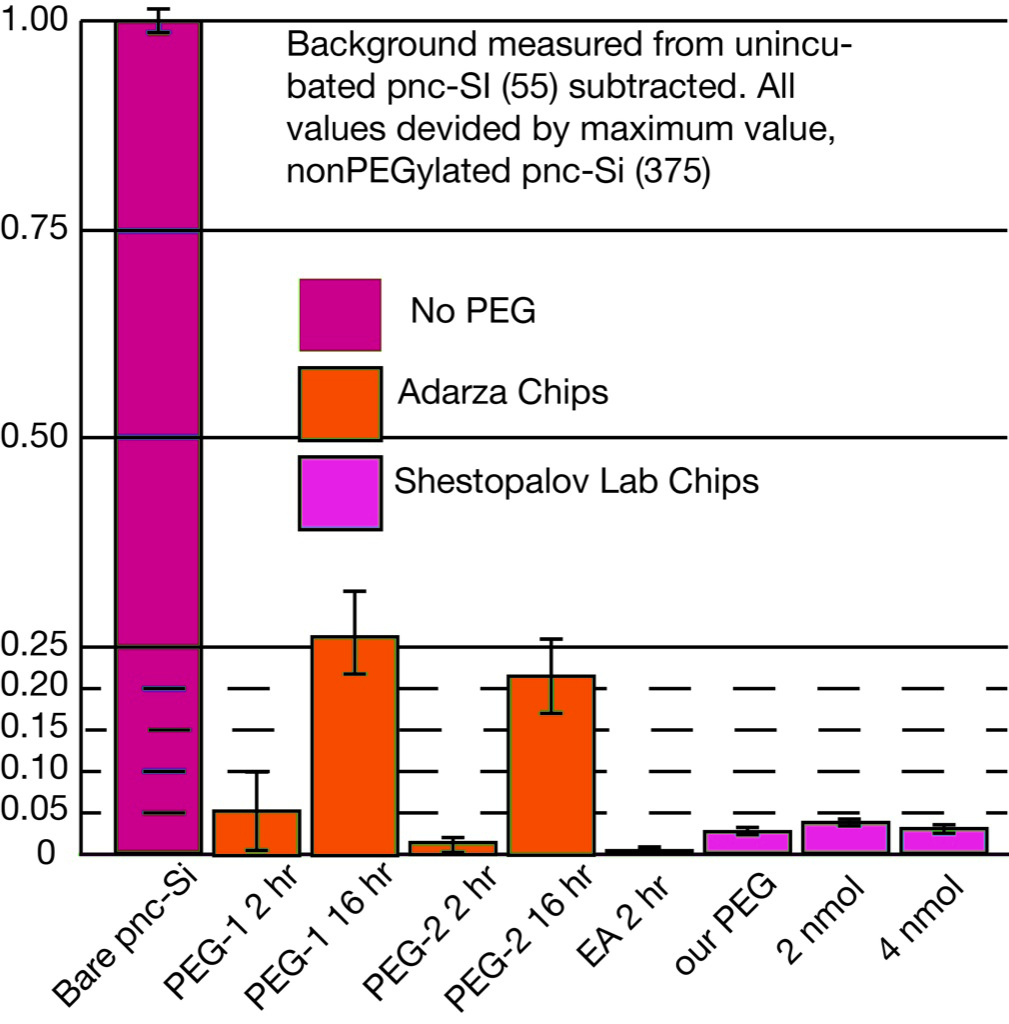
Comparitive Functionalization of pnc-Si measured with f-BSA fluorescence intensity
The last of the larger windowless pnc-Si chips were sent to both Adarza and Dr. Shestopalov’s lab for functionalization.
Adarza returned chips with PEG-1 and PEG-2 (different rounds of processing) with both 2 hours and 16 hour treatments. They also returned a set treated with an alcohol leaving group ,ethanolamine (EA). They did also supply some ‘control’ chips but I had to wait more than 24 hours before incubating so the adhesion of these controls were not included in this study.
Shestopalov’s Lab provided PEG in three varieties, The first utilized PEG chemistry provided by McGrath’s lab, the other two were 2 nmol and 4 nmol solutions using the PEG they had used previously.
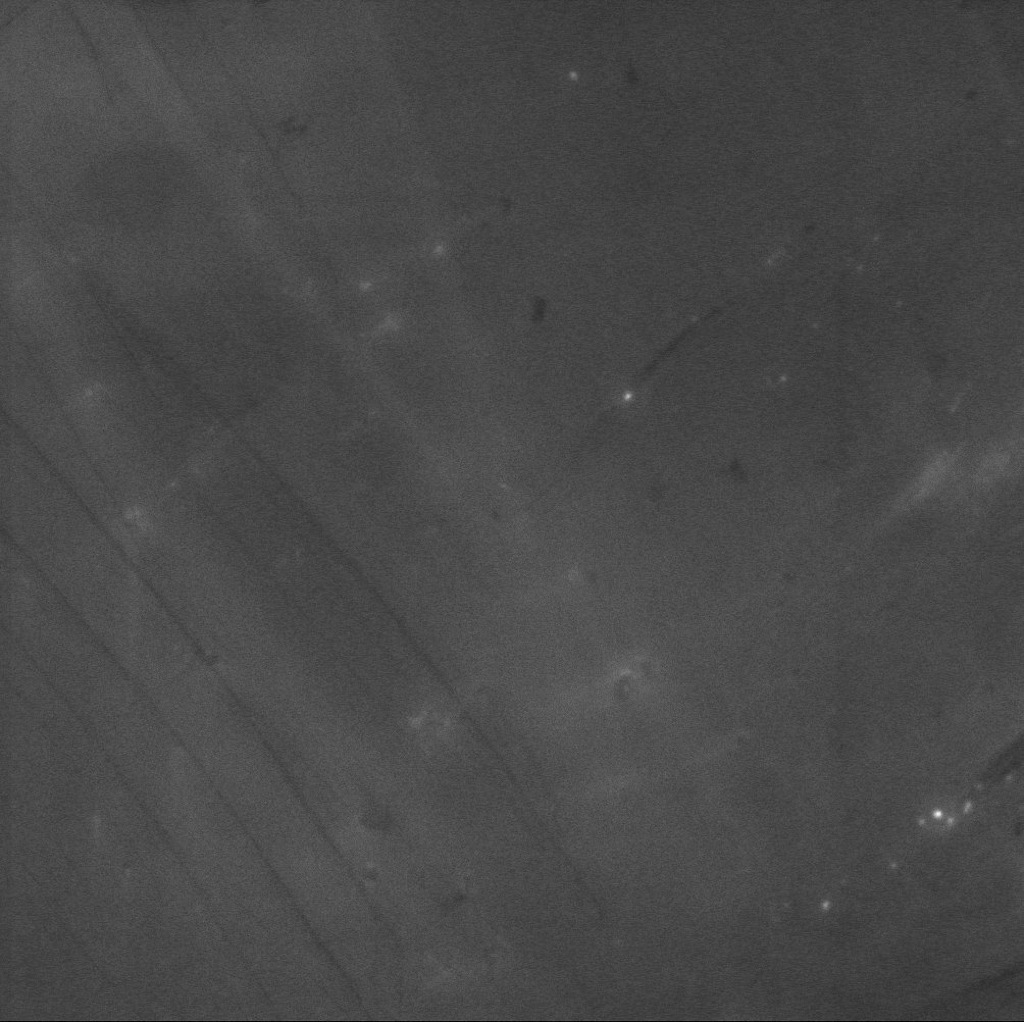
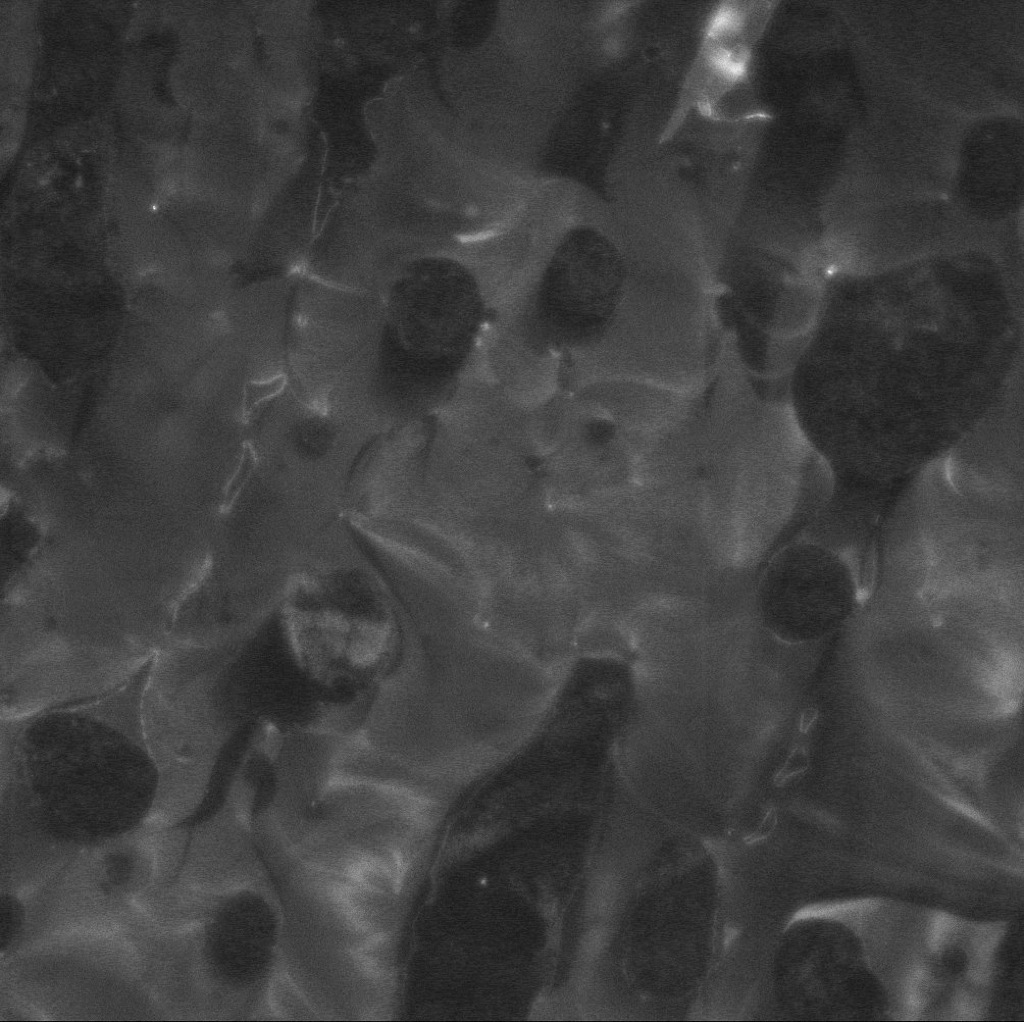
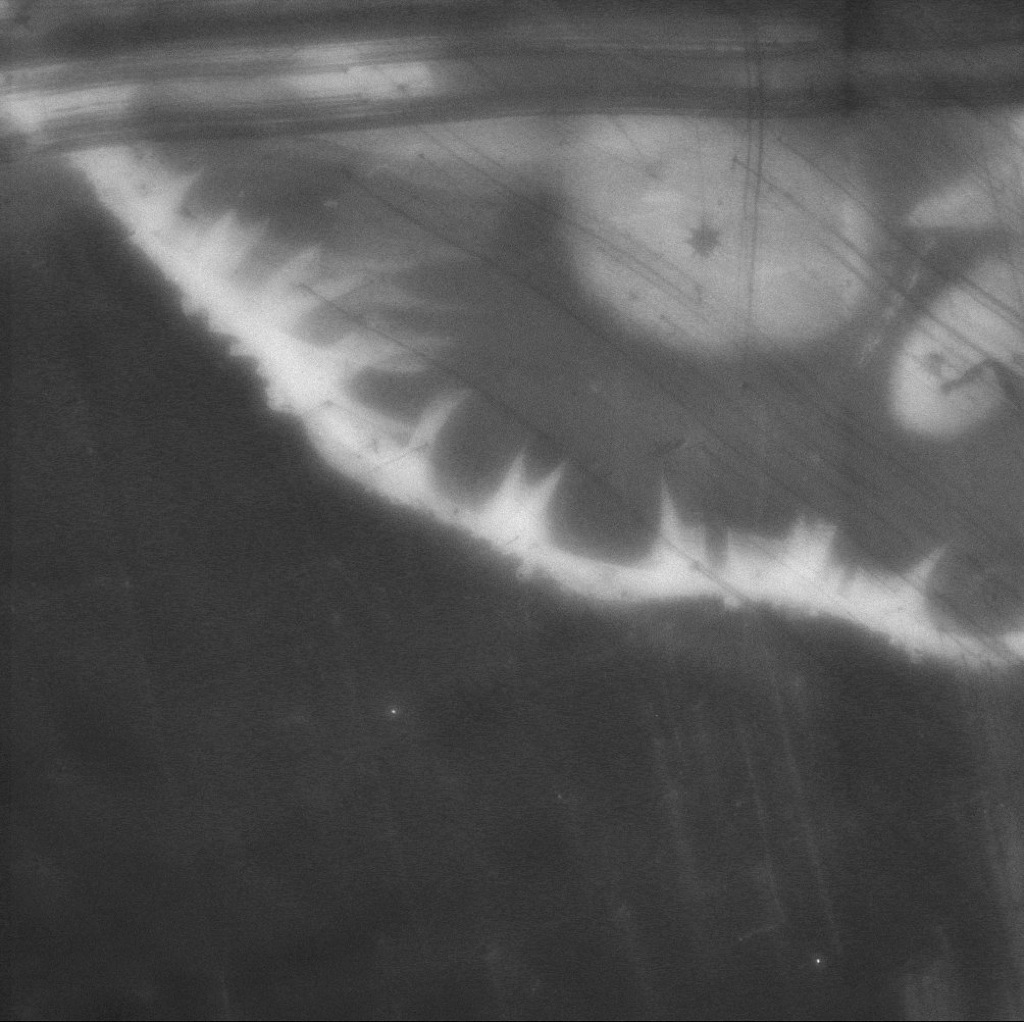
This series of images shows a normal, fairly even sample followed by two anomalous images. Some of the impurities and all of the scrapes you see are due to sliding across the microscope slide. Again, the second and third image below (Figures 2 and 3) are not typical of the images used for measurement.
|
|
|
|
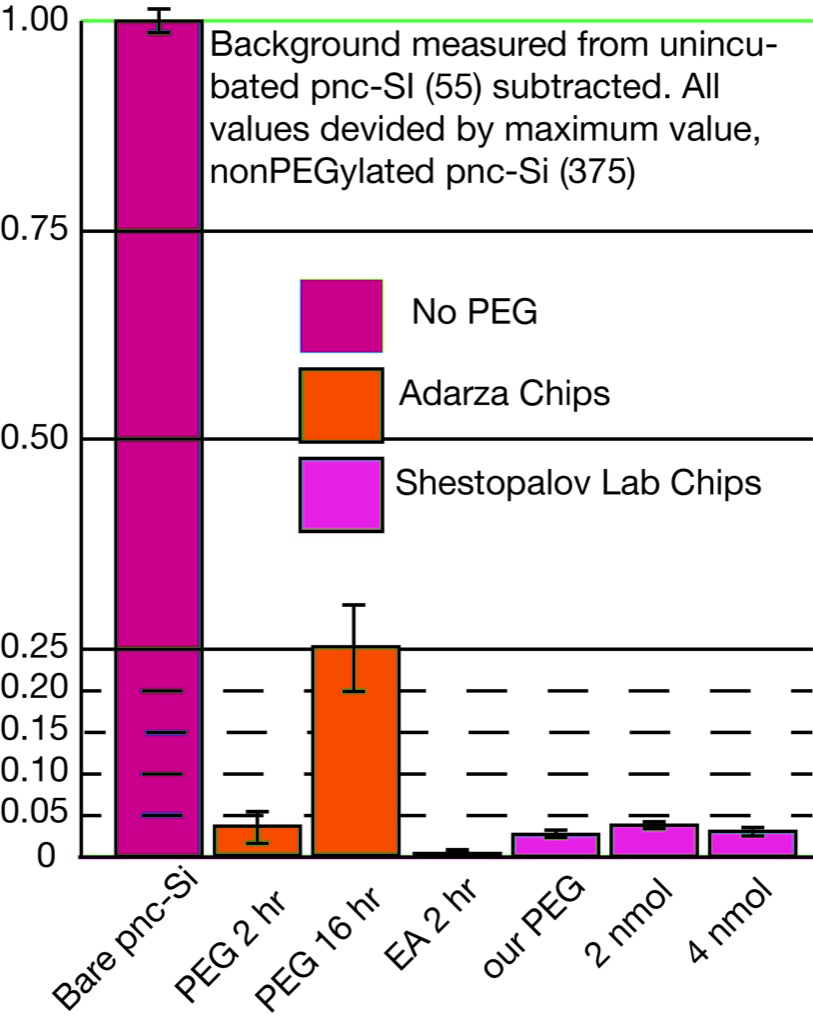
The first bar (Figure 4) shows the bare pnc-Si which had been UV treated only, It is apparent that all treatments improved the surface to reduce adhesion. The 16 hour Adarza treatments performed worse than the 2 hour treatments. It is unclear why the EA performed best of all. Chris explained that while the hope was that the 16 hour treatment would out perform the 2 hour treatment, the longer solvent soak can be problematic. This appears to have happened here. Even those reduced the adhesion to > 25% of untreated surfaces. All of the other treatments reduced to adhesion to 5% or less. Which is very good news and really what we had expected all along.
Nice. Where did you find PEG in the McGrath lab?
Tejas showed me where it was. Freezer I think.
There were 2 types of Adarza PEGS, but only one set is graphed. Is this the PEG-1 or PEG-2? These treatments are very different, so the distinction is important – one was deposited in toluene and the other in DCM.
Also, the process ran a little different this time, as the chips were freshly deposited. As I recall, the last time the scheduling was different, so the S-link was deposited a few days before the amine compounds went down. The fresher chips may have helped the EA go down a little more dense, so the difference may be real.
Next steps?
I looked more closely at the images to see what was behind the difference between PEG-1 and PEG-2 2-hour chips. One of the two PEG-1 chips is heavily patterned. The average intensity of the other PEG-1 chip is on par with the average of the PEG-2 chips. The sites on the chips is selected blindly. This will change when I switch to the 96-well plate chips where the TECAN will average the entire chip. (or so I assume)