FLAG Separation Experiments with an Enzymatic Activity Assay
As I mentioned in my previous post, there are a lot of problems associated with the technique for testing the ability of a CytoVu assembly to act as an assay that I had been trying to use before. Several possible sources of error were apparent, such as the difficulty inherent in consistently pipetting such small volumes (on the order of a few microliters,) the high concentrations of the reagents necessitating so many of the large avidin beads in solution that they settled quickly under gravity, and possibly the presence of large amounts of glycerol in some stock solutions, drawing water from the filtrate into the retentate.
To combat these issues, a few changes were made to the technique; most notably that rather than assaying directly for the amount of protein in the filtrate, I’ll now be employing a functional assay material which fluoresces when dephosphorylated by the alkaline phosphatase I’m testing for. Due to the nature of this assay, the range of concentrations that it’s sensitive to is much lower. Performing serial five-fold dilutions on the FLAG Bacterial Alkaline Phosphatase (“bAP”) that I’m using in my experiments, the following standard curve can be obtained:

In order to keep my concentrations in range of this assay, I diluted (part of) my stock solution of bAP down from 0.35 ug/uL to 39.94 ng/mL and took the rest of the reagent concentrations down to the appropriate levels to follow suit. These concentrations are now much closer to the types of concentrations recommended by the manufacturer, and the addition of relatively large volumes of buffer mitigates the effects of the glycerol that some reagents were supplied in. The new concentrations of the stock solutions as well as the new volumes of stock solutions found in each test solution can be found on this spreadsheet:
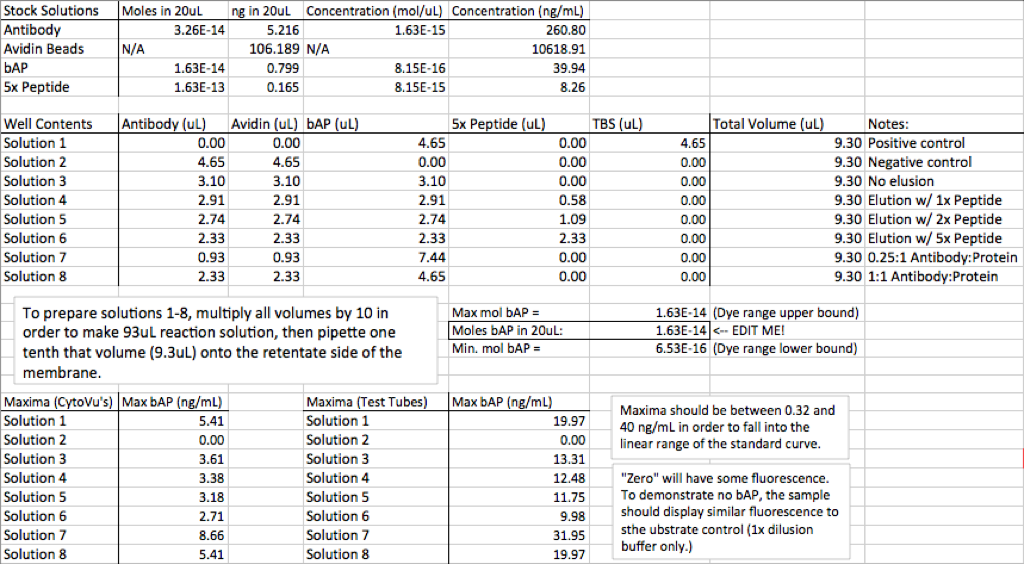
In order to negate the problem of such low volumes, and because of the increase in available volume of stock solutions thanks to the dilutions, reactions can now be performed in a ten-times scale increased volume. By pipetting ten times as much volume of each of the reagents as needed into a test tube before then pipetting one-tenth that volume into the retentate for separation, less room is made for error in the pipetting steps. Whereas before Solution 7, for instance, required me to pipette 0.93uL of two solutions and 7.4uL of another, now much more reasonable steps of 9.3 and 74uL can be made.
Finally, before starting the actual diffusion experiment, it’s been decided that a test is in order to ensure that the theory works out. Assuming it can be shown that the addition of peptide to the solution of bAP and antibody does in fact increase the signal from the fluorescent assay, it can be known that if similar results do not come out of the diffusion test that the problem lies with the nature of the CytoVu assembly itself and not with the theory behind the experiment.
To test this, Jim and Jamie came up with running the reactions in centrifuge tubes and then spinning them down before sampling the supernatant for bAP using the functional assay. In theory, the very large avidin-acrylic beads should readily be pulled to the bottom of the chamber under the action of the centrifuge (in fact gravity is sufficient, but the centrifuge compounds the effect,) bringing with them the biotin-conjugate Anti-FLAG antibodies. If there is no FLAG peptide in solution, then one would expect the FLAG bAP to be pulled down with the antibodies and beads, but with the addition of peptide to compete for antibody binding sites, more bAP should be free to remain in the supernatant and thus should show up more clearly when assayed, when compared to no-peptide samples.
The results of this test are very encouraging:
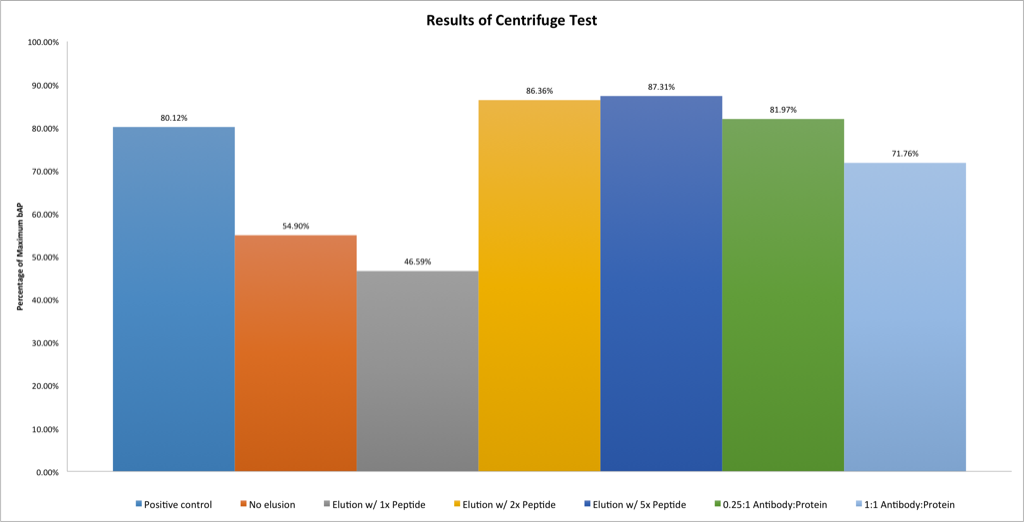
Here results are displayed as a percentage of the maximum possible value. That is, the supernatants were assayed for phosphatase activity and a concentration of bAP was calculated from the standard curve. Then, that concentration was divided by the concentration of bAP that would be expected if all the bAP in the system was free to diffuse about the chamber — that is, unbound to antibody. Thus, one would expect that the first case (bAP only) would have a very high percentage, the no elution case would be lower, and then the 1x through 5x elutions would increase in bAP content. The 0.25:1 and 1:1 antibody:bAP cases were extra tests to ensure our understanding of the theory; the decreased amount of antibody available to restrict the bAP should result in more bAP than the standard no elution case (which has an antibody:protein ratio of 2:1,) but less bAP than the high elution (2x, 5x) and no antibody cases. This is exactly what is observed.
Keen readers may notice that although eight tests were performed, only seven are displayed on the bar graph. The eighth was a case with no protein, only antibody and avidin beads (negative control.) This case doesn’t result in a presentable percentage for display because the expected maximum concentration of bAP is zero, but it too follows expectations in that it resulted in fluorescence only negligibly higher than the value at the y-intercept of the standard curve: the negative control sample had a fluorescence of 8433, whereas the curve intercepts the axis at 5080. For reference, the next lowest fluorescence value was over 17000, more than twice as high. In other words, the negative control behaved exactly like any other sample with no bAP present.
With this encouragement, I’ll be moving forward into performing separations with the CytoVu membranes. These results combined with the results of the Cytochrome C diffusion tests lead me to believe that this should go very smoothly. I’ll update this post as soon as I have more data to share!
UPDATE: So I came in briefly on Sunday in order to set up the diffusion experiment so it’d be finished with its 24 hour diffusion time by today. I analyzed the samples just now and I’m a bit confused by the results:
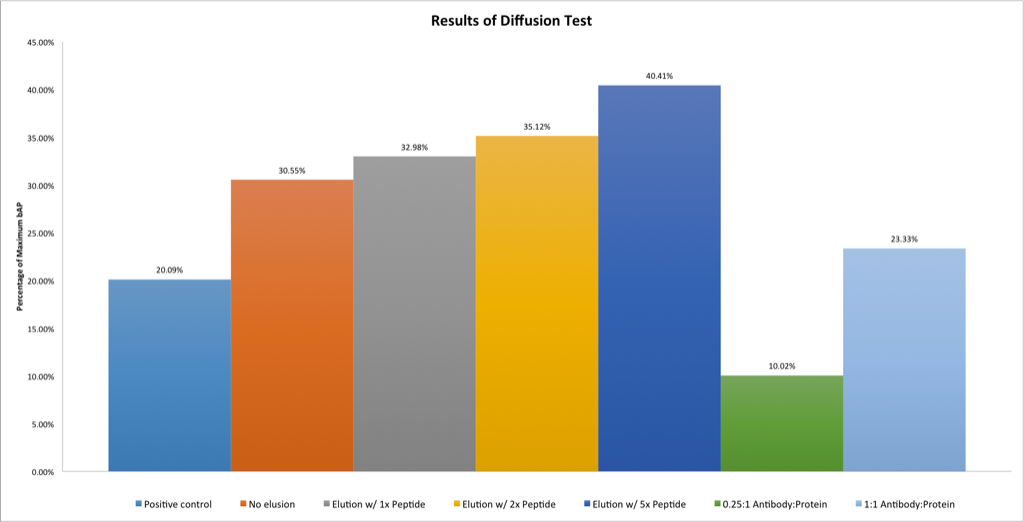
While some of the results make sense relative to each other, such as the elution samples displaying increased protein as more peptide is available, others make no sense: the decreased antibody cases are the opposite of what they should be relative to one another, and the positive control is extremely small, whereas it should be the highest of all. While it’s not shown here, the negative control also made no sense, displaying the second highest concentration of all the samples.
I’m unsure of what to make of this. Something peculiar I noticed is that every single one of the samples displayed very similar fluorescence; this is indicative of very similar concentrations of protein, and thus these percentage recovery numbers almost perfectly represent an inverse of the amount of protein stock solution which was added to the wells, since if all the concentrations are the same then the largest percentage value will simply be the sample with the lowest expected maximum protein at equilibrium (and so on.)
I’ve repeated the centrifuge test using the exact same samples (these same solutions have now been used for the first centrifuge test, for the diffusion test, and now for the second centrifuge test) in an attempt to collect more information on the problem. If the CytoVu assembly itself is was caused the nonsensical results in the diffusion test, then the results of the second centrifuge test should be essentially identical to those of the first test.
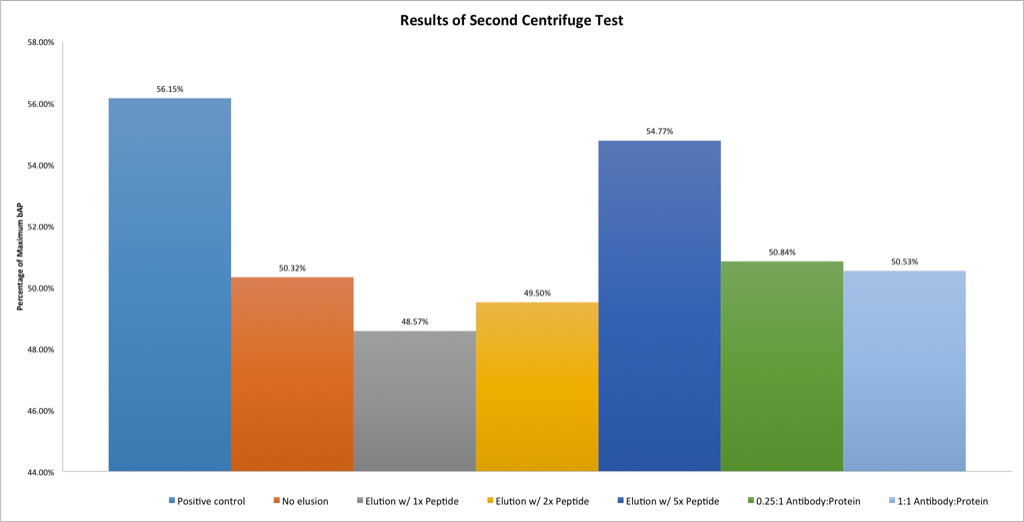
At first glance this graph looks very similar to the results of the first test, preserving almost all of the relationships and trends displayed the first time around. However, upon close inspection it becomes clear that something has changed: this graph is on a smaller scale. Whereas the positive control of the first test resulted in roughly 80% protein recovery, here only 56% is observed. In keeping with this reduction in phosphatase concentration, all other bars are shifted down as well.
It’s clear that the samples are not as stable as would be ideal, so while this wouldn’t necessarily cause the issues I saw in the diffusion test, I’m repeating the test with fresh solutions and CytoVu’s. This time I’ve also increased the amount of avidin in the solutions to the point that it is in extreme excess — my hope is that this will remove some error associated with these tiny concentrations by more firmly ensuring that no antibody escapes the retentate.
One final (and possibly very important) observation for this update: in both centrifuge tests, the negative control cases appeared to contain by far the lowest concentrations of phosphatase, but both still had fluorescence values slightly higher than the apparent bottom boundary of the linear range of the assays. That is to say that, very consistently, the test solutions containing no phosphatase fluoresce more brightly than the standard (known) solutions containing small amounts of phosphatase. This suggests to me that either something in the test solutions other than the phosphatase (that is, either the buffer (Tris Buffered Saline,) peptide, or antibody) encourages the fluorescence of the dye, or something in the standard solutions (and not in the test solutions — that is, the dilution buffer) restricts the fluorescence. In any case, it appears that the linear range may in fact have a lower boundary than previously thought, indicating that the results of the first diffusion test should be interpreted as “no phosphatase in any of the filtrates.” This is concerning, but at least it makes more sense than before.
A third centrifugation test, this time with the fresh solutions, has only served to further confuse me. I’m not sure if this is a result of freezing and refreezing the reagents a few times now or something else, but something is really amiss:
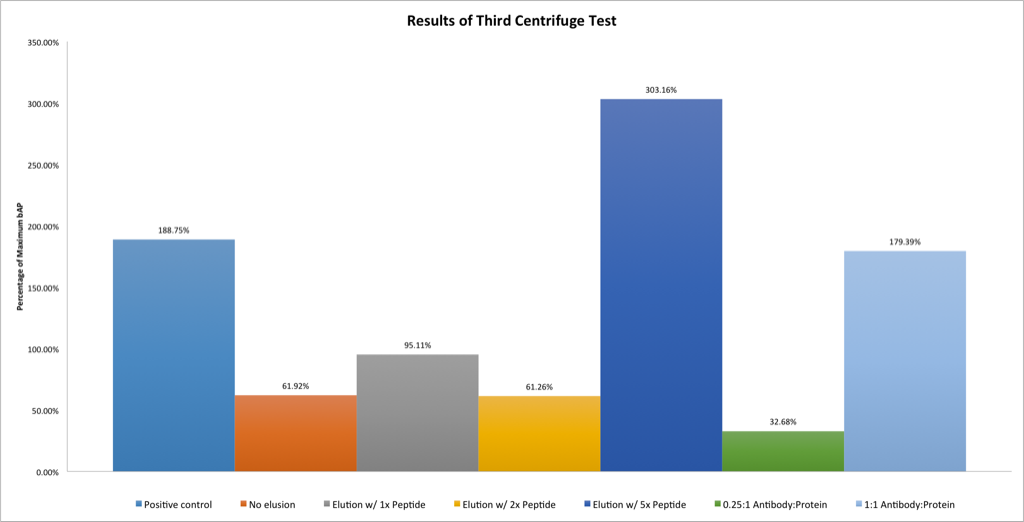
I just don’t know what to think anymore. I’ll be discussing these results with Jim and perhaps something can be worked out. In the meantime, I’m running another diffusion test with these solutions. I suppose I can at least hope for similar results from the diffusion test, so that the centrifugation and membrane separation can be shown to have the same effect.
A couple very important updates:
First, after more careful inspection I’ve learned that there were almost certainly no avidin beads in the test solutions used for the first two centrifugation and first diffusion tests. The beads are so massive that by mathematically diluting them to the proper amount, I ended up with so few actual beads in solution that there were almost certainly none in the samples I took to put into the test solutions. Nonetheless, the centrifugation appeared to work. Could this have been the result of the antibody being so much heavier than the enzyme?
Second, I’ve just performed a very straightforward control as per Jim’s suggestion: I placed 25uL of 0.04 ug/mL enzyme in a bottom well, 9.3uL of buffer in the top well, waited 24 hours, and then assayed the bottom well for enzyme. No enzyme appeared to be in the sample. It would appear that the CytoVu assembly is adsorbing or otherwise removing/denaturing the enzyme, and I have no idea why. I’ll be talking to Jim and trying to figure this one out.