Study of platelet activation for substrate hemocompatibility
Purpose: Study the hemocompatibility of different substrates using platelet activation as the indicator.
Extraction of platelet rich plasma (PRP): PRP were prepared from whole blood following the standard protocol outlined by Abcam (http://www.abcam.com/protocols/isolation-of-human-platelets-from-whole-blood). To describe briefly, 9 mL whole blood was centrifuged at 200g for 20 minutes in a 15 mL Falcon tube to obtain the supernatant (PRP).
PRP incubation: Three channels (1 mm x 2 cm each) were cut into a 1 mm-thick silicon gaskets. The gaskets were then placed on top of the substrates to be tested. Hole-punched PDMS blocks were then place on top of the gaskets to form the channel roof. The punched holes were positioned at both ends of the channels to allow fluidic access. Strips of tape were used to secure the substrates, gaskets, and PDMS blocks together. 20 μL of PRP were pipetted into each channel. All samples are kept in petridish and placed in an incubator (37°C; 5% CO2; 80% humidity) for 2 hr. Kimwipes that were prewetted with DiH2O were placed in each petridish to help reduce sample evaporation.

the substrates are: glass with 200 μM ADP (n = 3), glass (n = 3), lift-off membrane (n = 3), nanoporous nitride membrane (n = 3).
NOTE: After 2 hr, all samples were inverted upside down and let sit for 30 min to allow unbound platelets to detach by gravity.
Platelet label: The samples were washed with PBS, then fixed via 4% paraformyldehyde (20min). The samples were blocked with BSA(20 mg/mL) for 1 hr at RT, followed by incubation with primary antibodies overnight at 4°C. The primary antibodies are 20 μg/mL CD62P (label for platelet activation) and 20 μg/mL CD41 (label for platelet adhesion). Next day, the samples were washed with PBS, followed by 1 hr incubation with the secondary antibodies. The secondary antibodies are AF488 goat anti-mouse (100 μg/mL) and AF568 goat anti-rabbit (100 μg/mL). The sampled were then washed in DiH2O and let dry before imaging. DiH2O was used instead of PBS since salts crystals tend to reduce image clarity.
NOTE on reagents:
All from Abcam: Mouse monoclonal to CD62P (ab6632); Rabbit monoclonal to CD41 (ab134131 ); AF488 goat anti-mouse (ab150117); AF 568 goat anti-rabbit (ab175471).
Analysis of fluorescence image: A user-defined threshold (high pass filter) is applied to remove background fluorescence. The areas of the remaining image objects are then summed. The obtained value is then normalized by the total image area and reported as the % areal coverage by activated platelets. The fluorescence intensities of all image objects are also summed and reported as the degree of platelet activation. For the lift-off membrane, the SU-8 grid was removed from analysis. The total area/(total area – grid area) was used as a correction factor and multiplied to the lift-off membrane data set for comparison with other substrates.
Results:
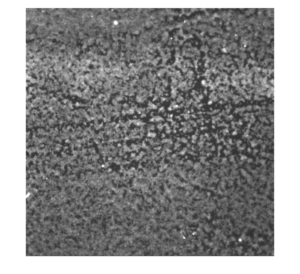
Representative image of platelet activation on glass, purposely induced with ADP (left: original; right: background subtracted)
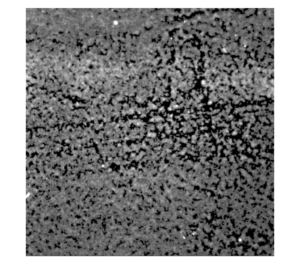
Representative image of platelet activation on glass (left: original; right: background subtracted)
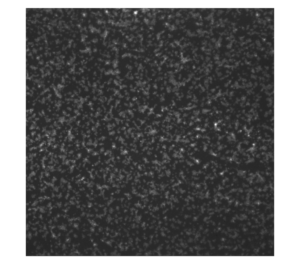
Representative image of platelet activation on the lift-off membrane (left: original; right: background subtracted)
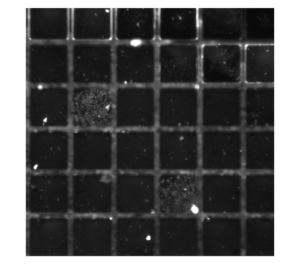

Interestingly, there tend to be more platelet activation in some “wells” (defined by the SU-8 grid) than others. This suggests that there are stochastic-based sites of nucleation for platelet activation.
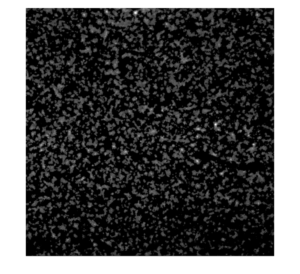
Representative image of platelet activation on the nanoporous SiN membrane (left: original; right:background subtracted)

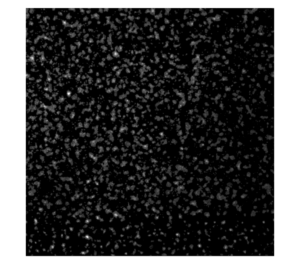
Fig. 1
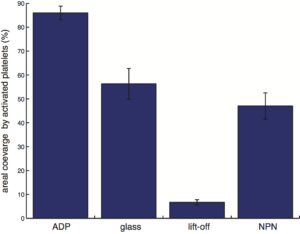
Fig. 2

- The error bar represents the standard error of mean.
- For each substrate type there are three samples, five regions on each sample are analyzed.
- No statistical differences are observed amongst the three samples from each substrate type, so the data are pooled together to produce n = 15 for each substrate type, except for the case of NPN. For ADP, glass, lift-off and NPN, n = 15, 15, 15, 10, respectively.
- For the lift-off membrane, the SU-8 grid was removed from analysis. The total area/(total area – grid area) was multiplied to the data as a correction factor for comparison with other substrates.
t-test with Bonferroni correction, an extremely conservative hypothesis test, was used for all pairwise comparisons. No difference is observed between glass and NPN in terms of the number of platelet activated (inferred based on the % area occupied by activated platelets, from Fig. 1). However, there is a difference between glass and NPN in terms of the degree of platelet activation (Fig. 2). Otherwise, differences were observed for all other pairwise comparisons.
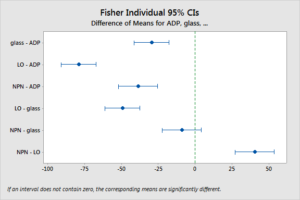
More (post hoc) hypothesis test: by Fisher’s LSD
comparison of areal coverage by activated platelets
comparison of platelet activation
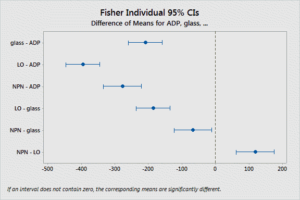
Essentially, the Fisher’s LSD arrive the same conclusion as the t-test with Bonferroni correction.
Did we do separate study of adhesion?
i did one set before in which PBS was used for the final wash instead of DiH2O. The image quality suffered due to salt crystals but the observed adhesion/activation is essentially consistent with this data set.
i actually co-labeled activation and adhesion. Basically all adhered platelets also showed activation, but vary in some degree here and there.