Continued Reverse centrifuge tests
Our first attempt to “reverse” centrifuge materials using our standard 5-slot filters made of NPN from wafer 1070 are detailed in a previous post using GEN2 SEPCON assemblies.
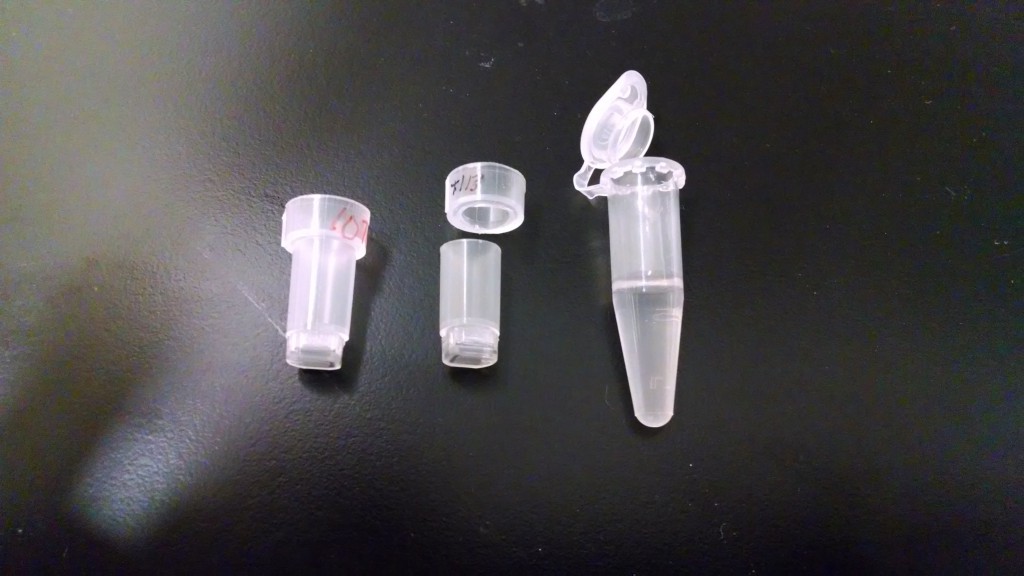
In this post we modify our method to more closely match the Sartorius Centrisart approach. To that end, we switch to using GEN3 SEPCONs because they are easier to assemble and because they have a round reservoir which leaves less “dead” volume between the reservoir and the centrifuge tube wall. We also cut off the top rim of the assembly so that it may slide as low as possible into the centrifuge tube. The image below shows a GEN3 on the left and a GEN3 with the top rim cut off in the middle. In the same vane, we fill the bottom of our typical 1.5 mL centrifuge tubes with 10:1 PDMS to reduce the dead volume below the filter.
Next we load the centrifuge tube with ~ 500 µL of solution and gently suspend the SEPCON on top of the solution. (We still wet the bottom and top of the 5-slot filter and push the SEPCON down into the solution slightly to ensure a continuous path for the liquid.
I started by mixing 20 and 500 nm fluorospheres in 1 X PBS (each diluted 100:1 from stock). After some “break-in” centrifuge runs at 2 and 3 krpm for ~ 10 minutes total, I set the centrifuge to 4 krpm and ran the sample for a total of 45 min. The yellow 500 nm particles had mostly pelleted out, the red 20 nm particles were still in suspension. The filtrate volume was ~100-150 uL and looked totally free of particles. Unfortunately, when I tried to draw some filtrate out, I pushed the SEPCON down and the retentate flowed over the top and contaminated the filtrate. (Not the last time I made that mistake)
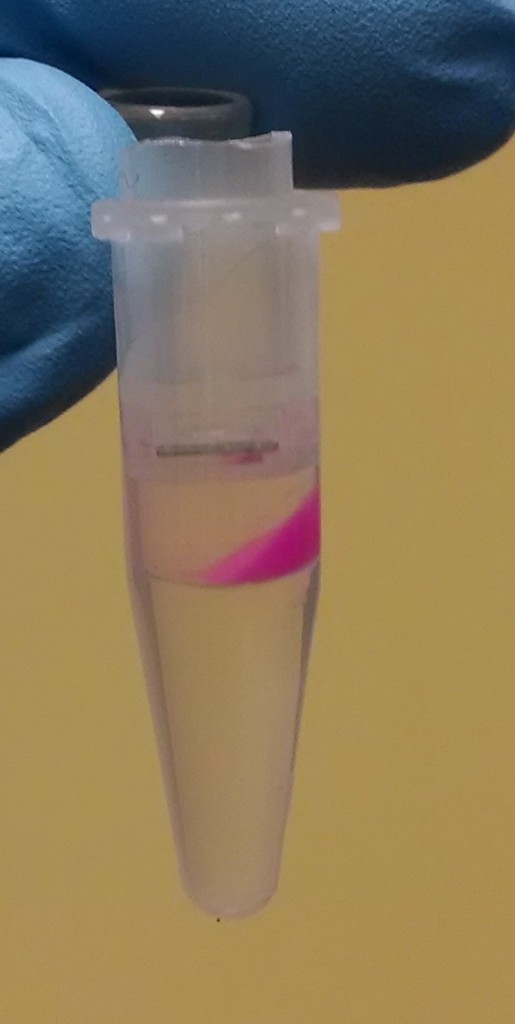
Assuming the filter held all the particles back, I moved on to trying to separate IgG from the 20 nm fluorospheres. I mixed 1500 µL 1X PBS + 150 µL 20 nm NPs + 150 µL of 10 mg/mL IgG. (the IgG is material left by Tom Berkelman, so there’s always some chance I misinterpreted the concentration. If the absorbance below seems off, that might be why) The photo below shows that after 2krpm for 1 minute the particles (and presumably the IgG) have aggregated and settled at the bottom:
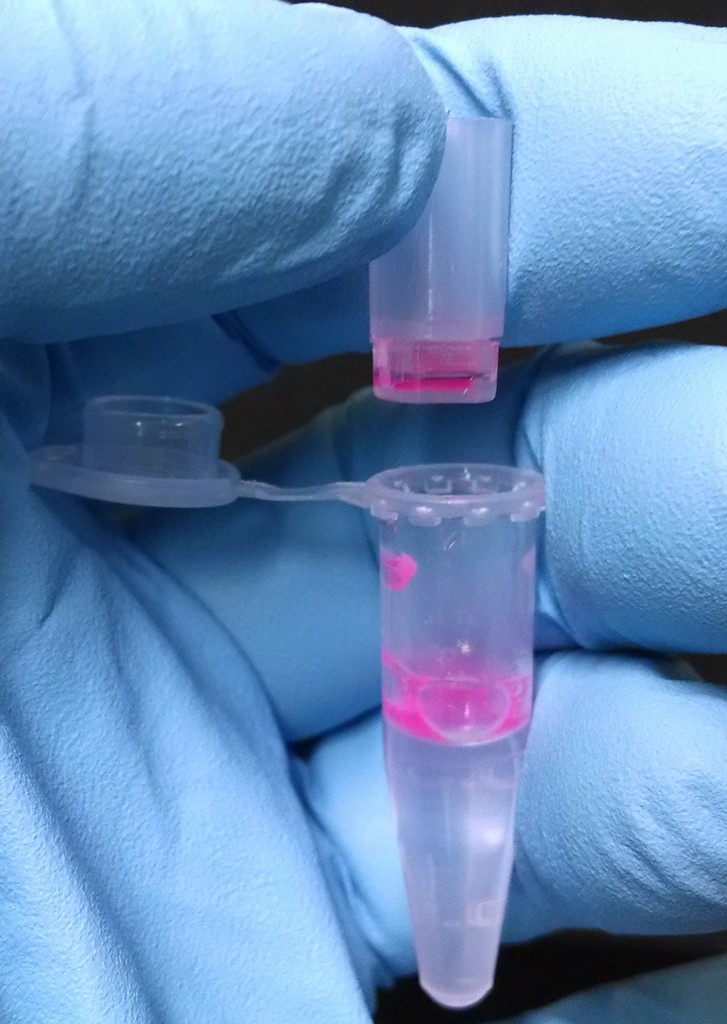
I wasn’t completely surprised by this result given that we had discussed the necessity of adding “pixy dust” to prevent aggregation during Tom B’s visit. So next I tried using some of the PBS/Pixy solution Tom B had left to suspend 20 nm fluorospheres and IgG. I got more aggressive this round and diluted each 10:1. I believe that’s ~10^15 flourospheres/mL and 1 mg/mL IgG. After 4 krpm for ~30 minutes there wasn’t much filtrate, so I increased to 5 krpm and let it go for 40 minutes. At this point I pulled 60 µL of filtrate our and added 150 µL to the retentate. After an additionl 60 minutes at 5 kprm I retrieved an additional 100 µL of filtrate. At the end the tubes looked like the following photograph. There are a lot of bubbles in the centrifuge tube, but there was never any apparent aggregation. The bottom bucket of the SEPCON gets pretty vivid in color as the solution concentrates. (as I write this, I realize I should have pulled that out to add to the retentate for spectral analysis. whoops). If we continue with this approach, we should test open bucket configurations.
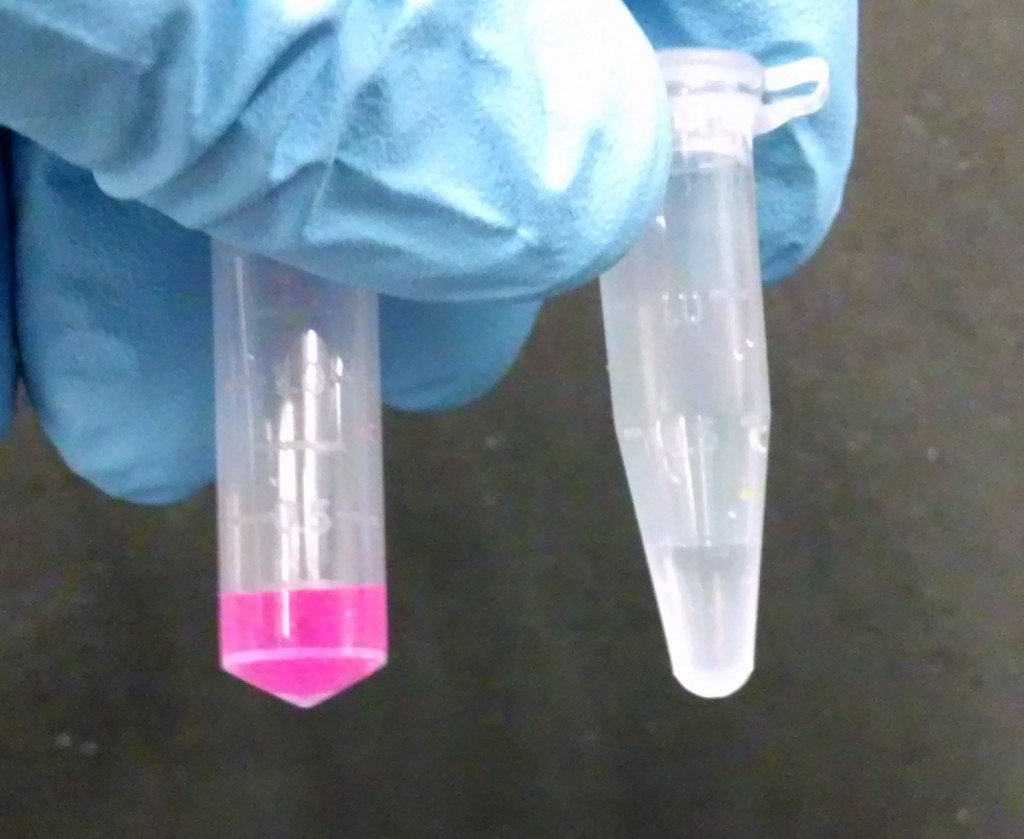
And here’s a quick photo comparing the stock solution (left) to the filtrate (right):
Finally, we look at the fluorescence and absorbance data using the Nanoquant plate in the TECAN. (Sample sizes are 3 µL.)

The fluorescence data indicates pretty clearly that the 20 nm particles are not passing the membrane, but are getting concentrated in the retentate. Now the big question is whether or the the IgG is passing through.
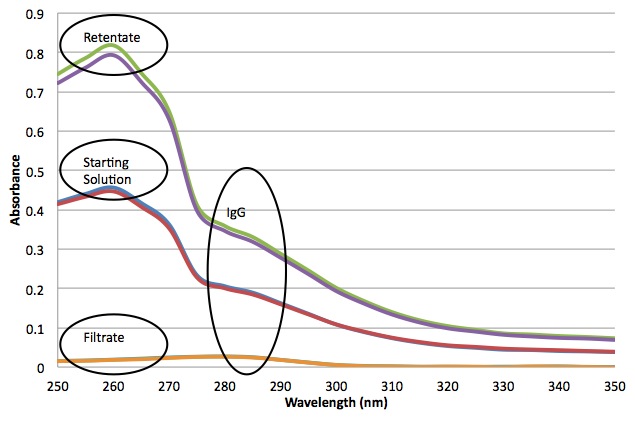
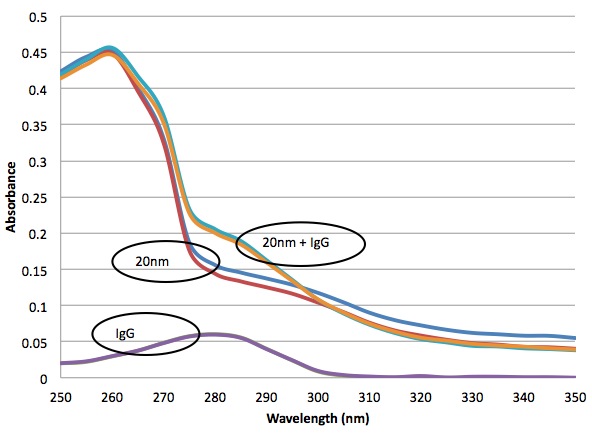
I wasn’t expecting a strong absorbance from the 20 nm fluorospheres near the IgG absorbance peak (280 nm), but now I know better. For context, I plot some control solutions that are just the particles or just the IgG, along with the absorbance from the mixture:
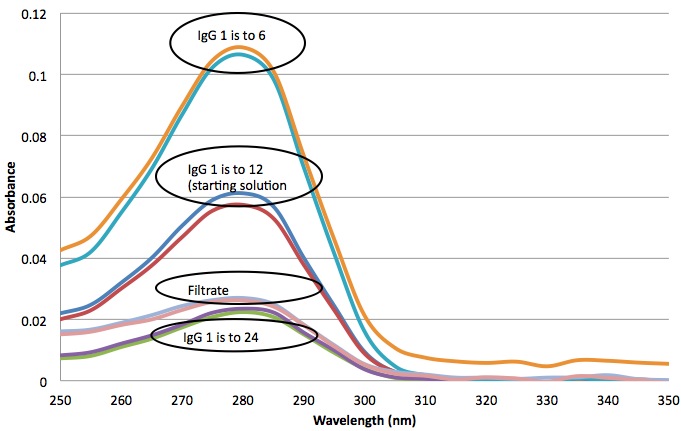
Finally, here is a ladder of IgG concentrations in the PBS/Pixy solution: We see that IgG is making it through the filter, but flow is being restricted. Or possibly, the IgG is being adsorbed onto the filter. (Unfortunately, I can’t measure the concentration of IgG in the retentate because I don’t have reference 20 nm absorbance curve to subtract)
I hesitate to say this, but here goes: These are really good results. I need to try this test with Tom B’s materials next. I think we can start to get imaginative with the tests we want to take on using the NPN filters.
I am a little concerned that the PDMS in the bottom might interfere with our tests by dissolving or who knows what. I’d like to find a snub-nosed centrifuge if possible.
Cheers- Josh
This is getting very exciting! We may actually be able to solve someone’s separation problem after all these years.
We need to be confident of the filtrate concentrations. Assuming the ratios in the last figure are relative to the 10 mg/ml stock, we are getting better than 50% of 1 mg/ml concentration through (check my math) which would be very workable. The ultimate goal is to ‘clean up’ NPs so that no unbound antibody remains. This will need repeated suspension and filtration.
I really like the SepCon Gen3 modification. There are flat bottom centrifuge tubes commercially available. I’m sure VWR has them.
I don’t understand …
“I got more aggressive this round and diluted each 10:1.”
Looks like the first trial was also 10:1 just without pixie dust.
Since this is a clean up process, it might be good to report a % reduction in IgG. From the scans, I actually think it is fairly low at the moment, but I assume there is quite a bit of room for improvement. Is there room to increase the pore size to allow the IgG to pass more efficiently?
Any idea how much of the IgG needs to be removed to be useful? Maybe 90%? I’m just curious how high the bar is.
Thanks!
Jim- I had typically been diluting 100:1. Only on the last two tests did I do 10:1. I should have made the “more aggressive” comment before the test where we saw aggregation.
Our 2 mL centrifuge tubes are flat bottomed, but the SEPCONs won’t fit inside. I’d like verify the fit before ordering.
Chris- I agree a % reduction would be a good metric. Does it make sense to simply divide the 280 nm absorbance of the filtrate by that of the starting solution? .02/.06 ~ 33%. I also agree that this test leaves room for improvement. Wafer 1070 has ~15% porosity and ~40-50 nm pores. I’m not sure how much larger we can make the pores and still block the 20-30 nm fluorospheres. Wafer 1085 is 24%/70nm, so we will try some of those next. I don’t recall discussing a bar for the clean-up. If we share this information with our collaborator he might be able to give us an idea of what he expects.
I’m not sure how idealized a test this is. I simply combined the fluorospheres and IgG. I’m what, if any, fraction of the IgG is binding to the fluorospheres. I suppose we will never get the IgG flushed out if it is sticking to the fluorospheres. I will continue the tests with the material provided by Tom B and see how the results compare.
Taking the ratio is reasonable, but then you have to factor back the retentate volume relative to the filtrate to get the total mass remaining in the solution of interest. In the actual cleanup, I guess you would then add buffer to the retentate and repeat the process until the free IgG is flushed out. The substantial residual volume of retentate with this method makes this type of cleanup less efficient than dialysis or a spin-through process, but perhaps an optimal design could make this more favorable.
I did not realize that the the IgG and fluorospheres could still be interacting. In this case, you might be better than you think at removing free IgG. Can the Malvern help tease this out or are the volumes too small? Have you tried just spinning IgG through the same membranes to determine a permeability without the spheres?
Thanks!
I haven’t tried the Malvern to determine whether IgG may be interacting with the fluorospheres, but it is worth doing.
Spinning the IgG by itself as a control is a great idea and I’ll try that as well.
Thanks! – Josh