Animated Concentration Profiles of Gold During Constant-Pressure Separations
All separations are 30 nm (diameter) gold nanoparticles in a 56 nm pore setup, with other parameters as described in my last post. Y-axis scale bar is in meters, x-axis scale is meaningless (the simulation is 1-D, and the width is added just for clarity’s sake). The membrane is at y = 0. Color corresponds to the natural log of the concentration, with the colorbar range explicitly set to be the same for both sets of graphs (so cross-graph color comparison is OK). All .gifs have the same number of frames (180) and frame rate (0.1 seconds/frame).
0.1 PSI – first 20 uL passed
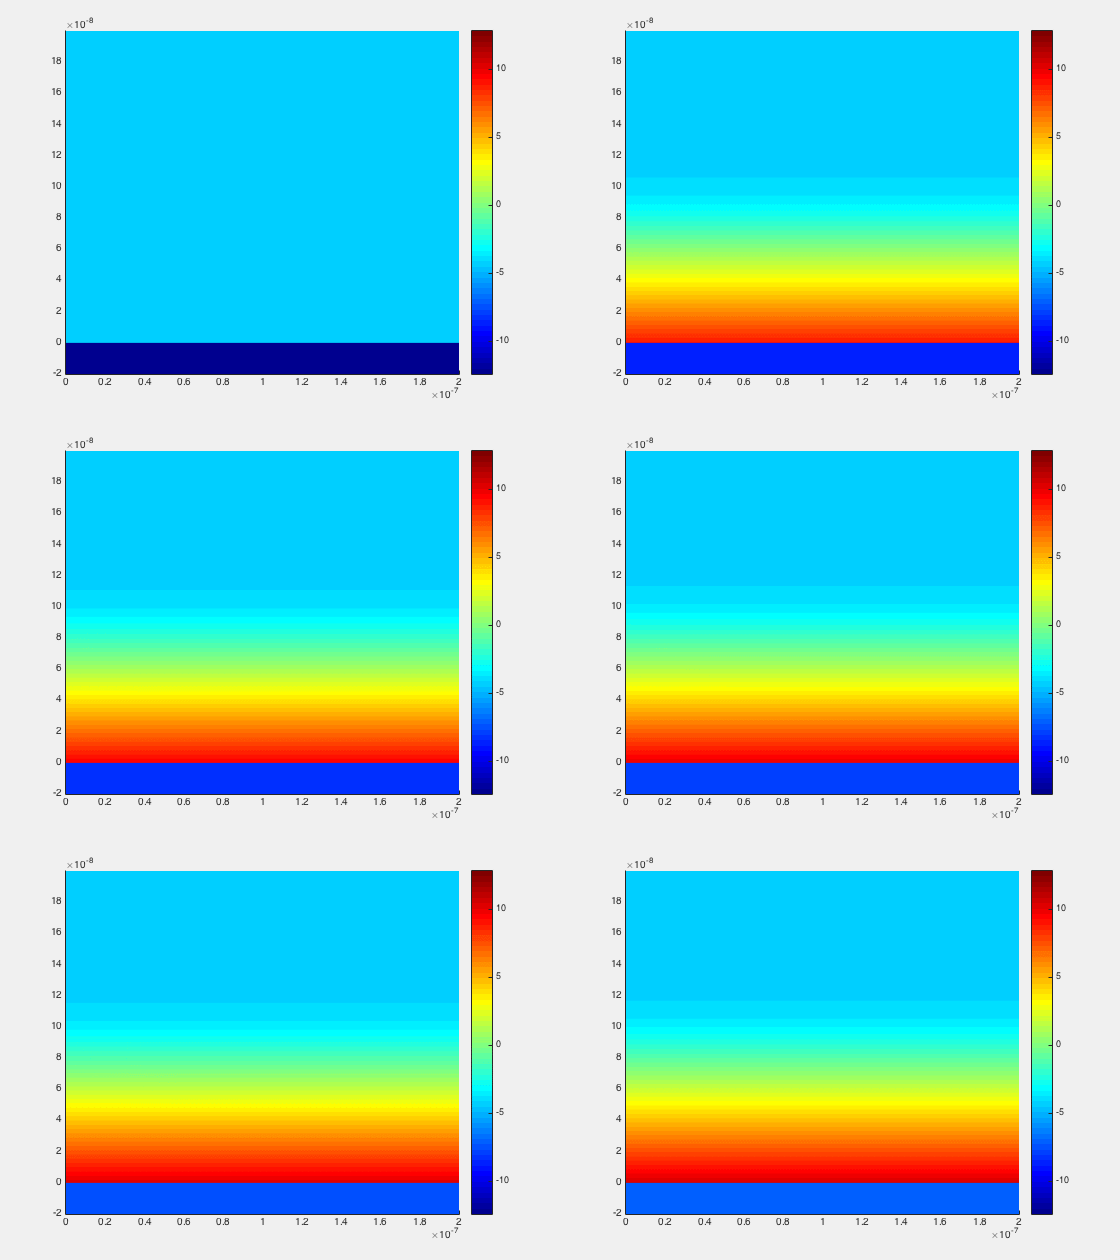
200uL passed
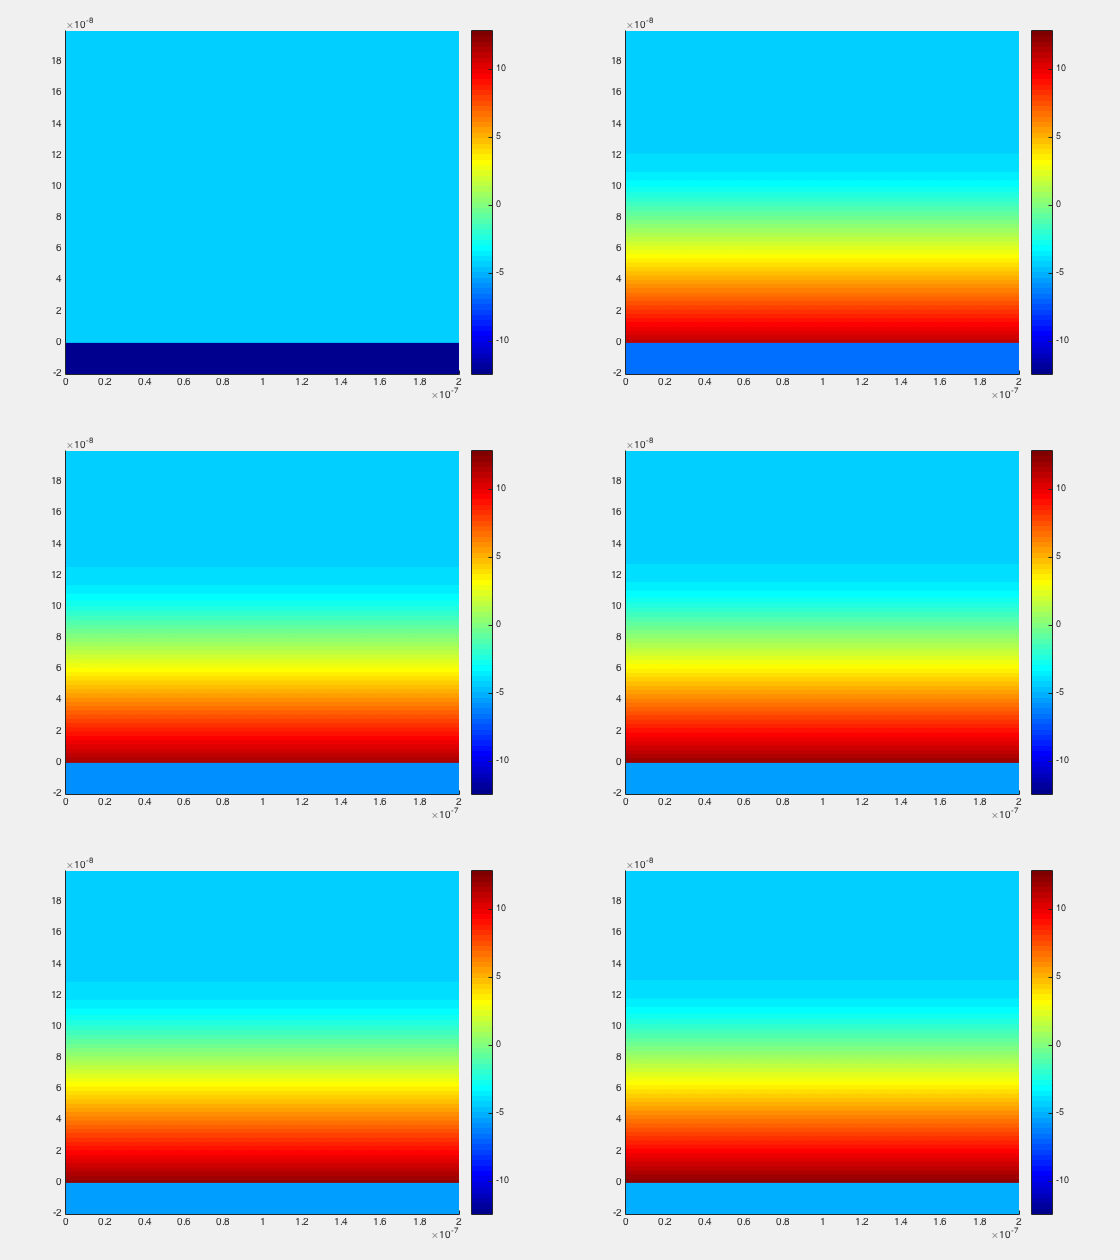
Concentration at membrane after 200 uL passes: 2.4E5 M
Concentration of filtrate after 200 uL passes: 0.0053 M
Concentration of starting sample: 0.0141 M
**************************************************
1 PSI:
first 20 uL passed:
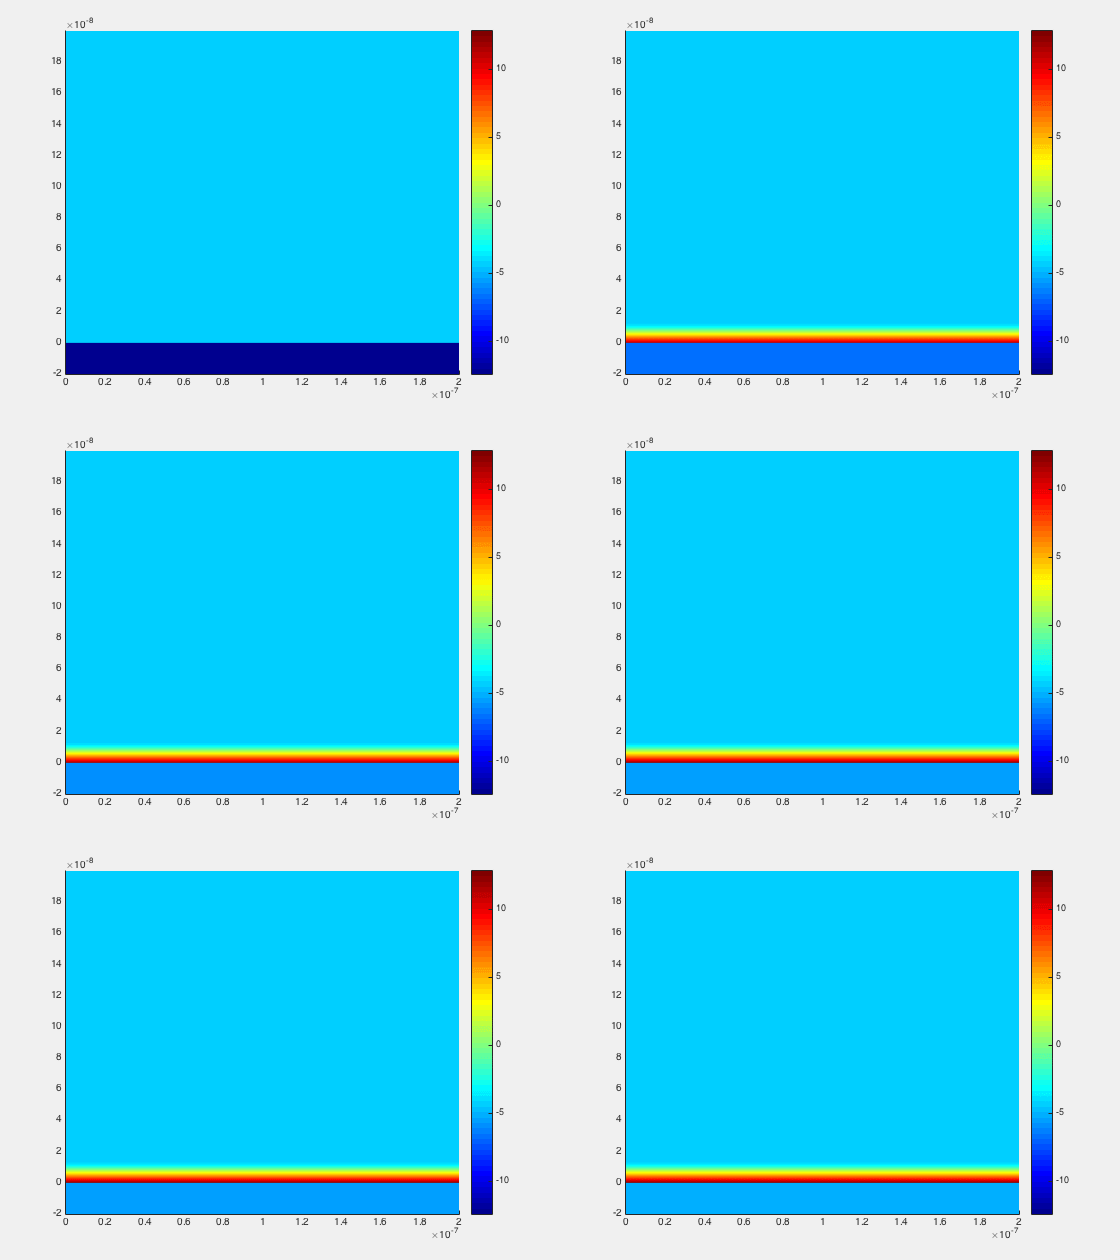
200 uL passed:
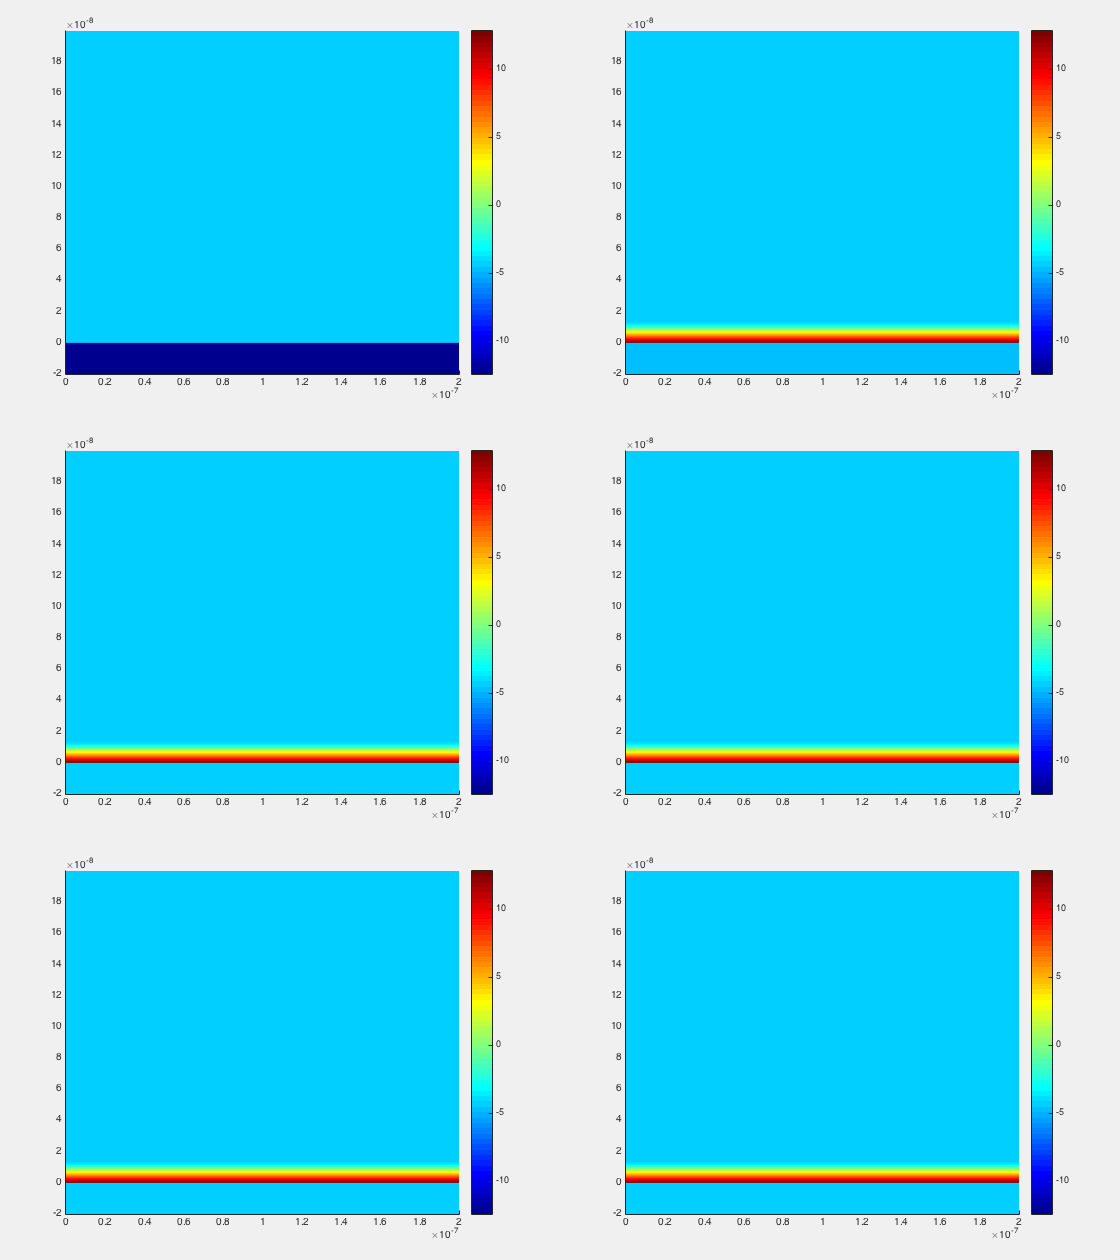
Concentration at membrane after 200 uL passes: 3.7E5 M
Concentration of filtrate after 200 uL passes: 0.0128 M
Concentration of starting sample: 0.0141 M
**************************************
Observations:
The model accounts for the fact that the volume of the filtrate is growing over time, so it’s interesting that the concentration of the filtrate nonetheless increases over time.
There is a seven-order-of-magnitude difference between bulk/starting concentration and membrane concentration. I very much doubt that gold nanoparticles are capable of maintaining a ~10,000 molar concentration without something untoward happening (that’s a density of 8.5E7 g/cm^3, and the core of the sun has a density of 150 g/cm^3, so maybe we can expect cold fusion?!) What’s remarkable to me is that the model continues to agree so well with experiment even with this obvious flaw. Accounting for the fact that the gold adds resistance and can only compress so much without pushing back is up next.
This is getting better each time! Can you report the concentrations in #/ml please. Also, there is something non-intuitive about a color scheme where darker blue is less concentrated than light blue. Perhaps if you just dropped the dark blue so that light blue was as the maximum concentration.