Reviewing membrane impact
To identify how much of an effect the membrane has on particular simulations, we originally came up with the idea of using a phenomenological effective diffusion to view the membrane impact (see this post). Here is the most up to date version of the figure, which was slotted for use in the simulated diffusion paper:
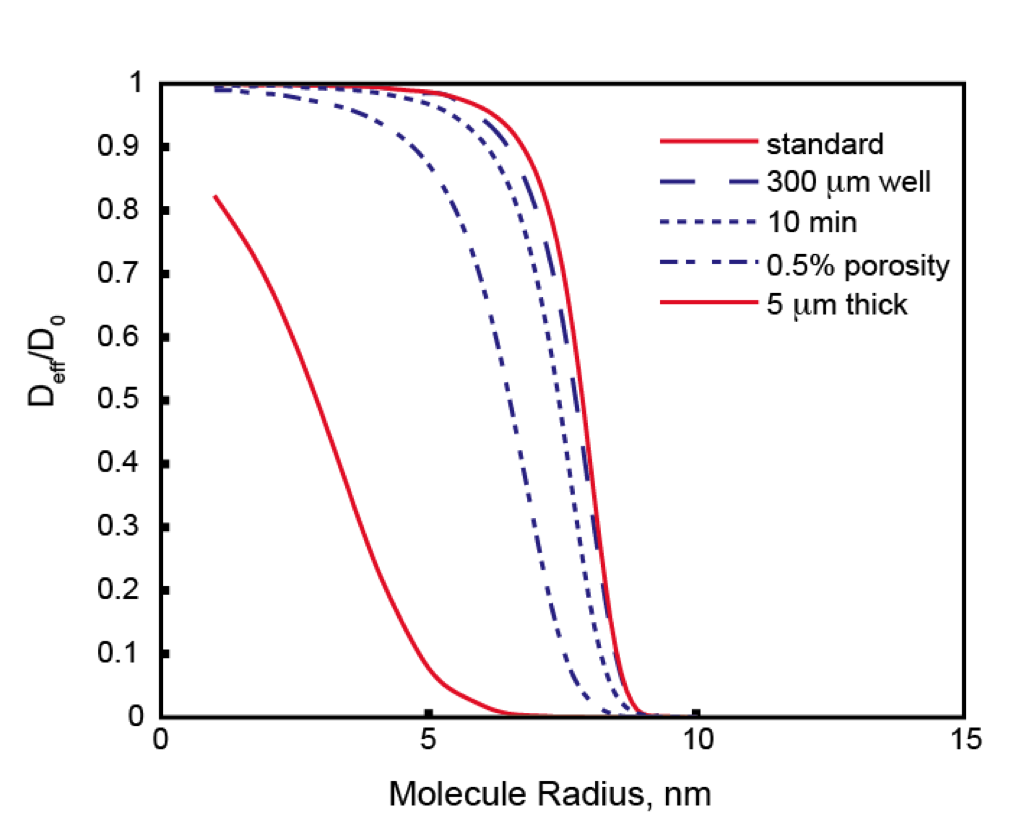
(Standard = 1mm fluid wells, 15nm thick membrane, 10nm pores, 5% porosity, 1 hour separation)
Brief Explanation: A separation with a membrane gives a sieving coefficient for a particular sized molecule. A separation without a membrane gives a different sieving coefficient related solely to the free diffusion coefficient of that molecule. We then ask which diffusion coefficient would give a similar sieving coefficient to the membrane separation, and normalize it by the actual free diffusion coefficient for that molecule. The drop off from 1 indicates the effect of the membrane on the simulation. Deviation from the standard line indicates how the different variables affect the separation.
Now the trouble with this figure is that it is complicated to explain and understand. It does however provide an interesting look at how the membrane can have a larger overall effect on the separation of all sizes of molecules given certain situations.
In an attempt to simplify this, I have tried taking the ratio of the membrane sieving coefficient to the no membrane sieving coefficient. The next figure does the same analysis as above but with the different ratio:
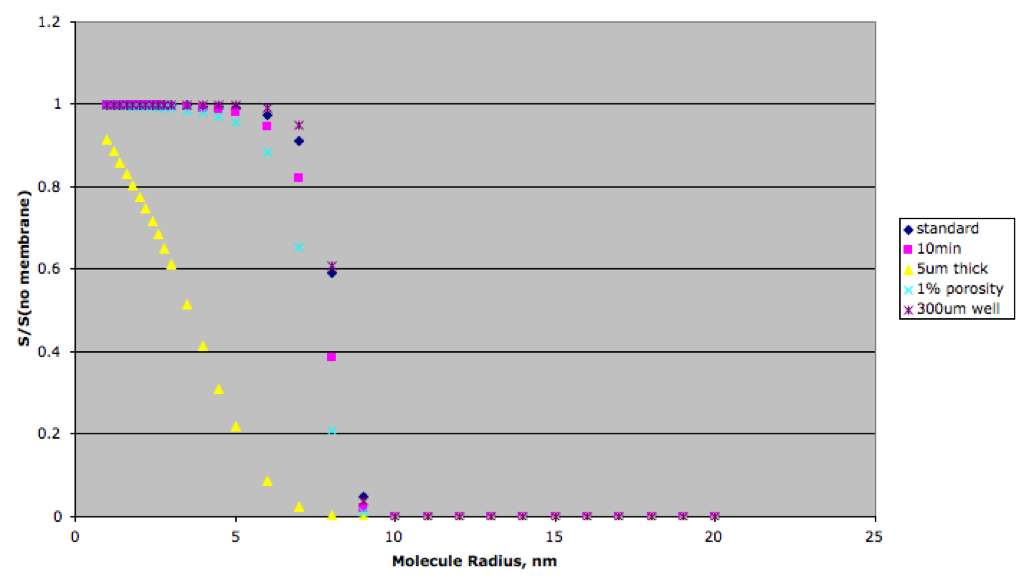
Immediately, you can see there’s not quite as much of a spread in these curves as there is for the Deff/D0 graph at the top of the post. You can still see that lower porosity, shorter times, and thicker membranes mean smaller molecules can feel the pores more. However the smaller fluid well system is similar to or has less impact than the standard, which is in disagreement with the Deff/D0. Perhaps there was a mistake in making the original Deff curve, but as far as I can tell I’ve done sieving ratios curve correctly. I’ve also plotted a system with 10mm wells (not shown) and that is similar to the standard separation as well.
All of these simulations are done with the 1D model, not comsol, so the only geometry change is a lengthening of the wells. The concentration profiles will still be symmetric, and the actual ratios will be different than the standard separation (i.e. a smaller system comes to equilibrium quicker for most of the molecules). It seems though, that when normalizing the smaller well membrane simulation to a smaller well no membrane simulation, you get similar results to the standard size normalization.
I guess what I really want to get from this post is A) is the normalized sieving coefficient chart easier to understand, and B) does it make sense that the membrane has little or no additional affect when lengthening/shortening the wells?
I don’t like the loss of the spread. Although the sieving coefficients are the bottom line, they are probably less sensitive to these environmental variables than the flux which is proportional to the diffusion coefficient. I think Chris suggested plotting flux in response to your original post. Flux membrane/flux no membrane. Lets try it.