HMM Diffusion through pnc-Si Sepcons
Carrie and I have been trying to detect HMM (APOBEC3G) diffusion through Sepcons without much luck. We determined that the dilution factor (~1:30) for diffusion in our 384-well plate format was too high to detect HMM in the basolateral well. To try to get around this problem, I decreased the volume (and thus dilution factor) of the wells with PDMS but that didn’t work. We’ve also tried to used square Sepcons with even smaller volumes (21uL per pnc-Si side) to decrease the dilution factor. In this post, I present that data, along with protein measurements with a new, more sensitive general protein assay called Quant-IT (Invitrogen).
Set-up: I used SC364 square Sepcons and after getting rid of RNAses, I added 21uL of HMM buffer to the basolateral well of the Sepcon and 21uL of 2.2mg/mL HMM to the apical well of the Sepcon. I placed the Sepcons in a 15mL conical tube, pre-filled with H2O for humidity, and placed in the refrigerator overnight. I used 2x SC364 with pinholes as positive controls, 1x SC364 without pinholes and 1x SC364 without pinholes (but treated with RNAse to break up the HMM). I also set-up a BSA diffusion for comparison but the sample broke so I’m not including that data. I did compare the Quant-IT data with Bradford absorbance values to determine which is more sensitive.
Here is the BSA standard curve that I typically do with Bradford. This isn’t really relevant to the rest of the experiment but I wanted to show that standard curves for this assay are sigmoidal across large concentration ranges (and pseudo-linear at best with smaller ranges). Example sigmoidal standard curves from the manufacturer are included below, also.
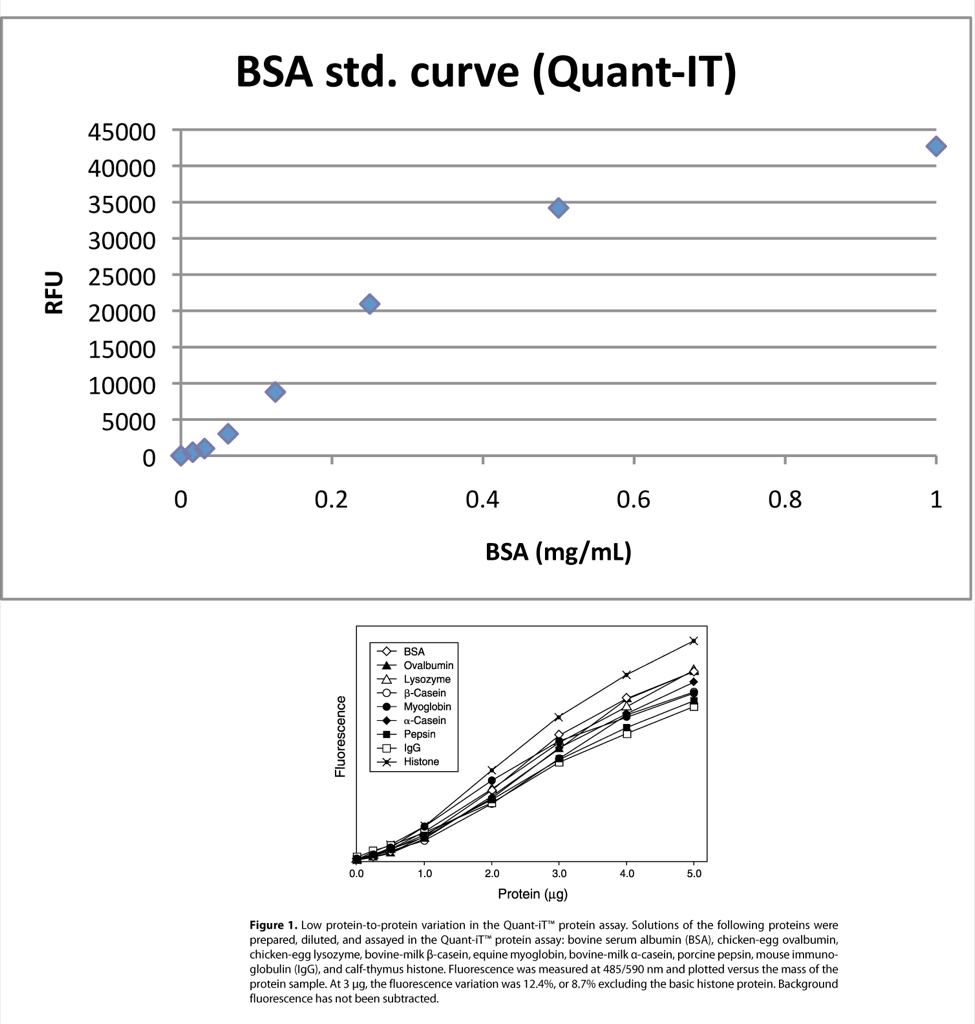
The graph below shows a comparison of detection limits for BSA and HMM via Bradford and Quant-IT. I normalized the y-axis as % of the value compared to the maximum ABS or RFU value (1 mg/mL for BSA, 1.1 mg/mL for HMM). This isn’t the best normalization but it illustrates the point. The detection limit is at least 2-4X lower with Quant-IT than with Bradford for BSA and HMM.

Here, I measured the RFU values for HMM buffer (background), HMM stock (2.2 mg/mL), HMM diffusion through a broken chip (positive control/expected equilibrium), HMM filtrate through a no pinhole membrane and digested HMM through a no pinhole membrane.
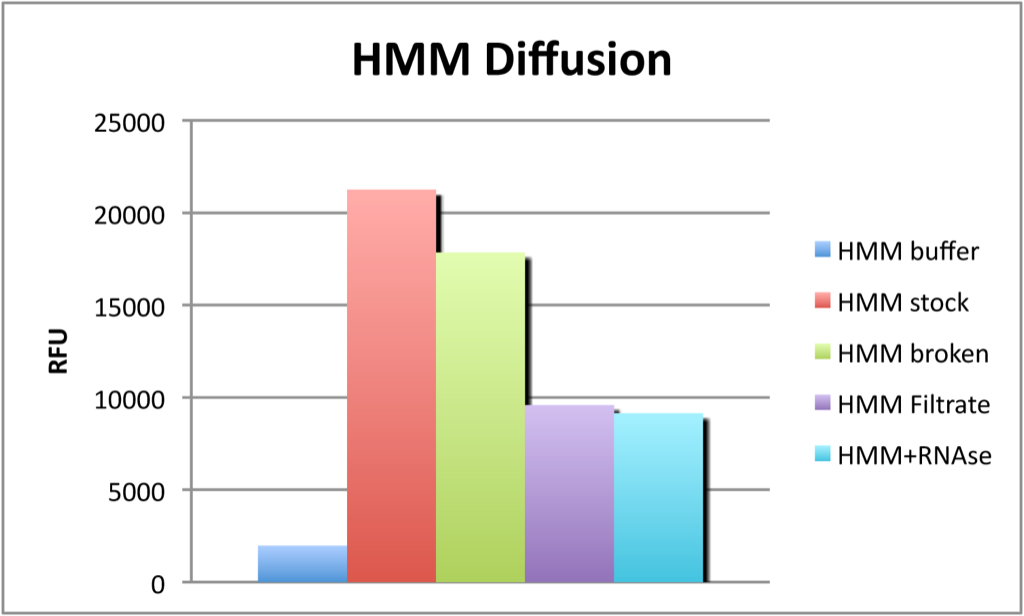
HMM buffer is very low and HMM stock gave a large fluorescent signal. I expected HMM broken to be about half the stock concentration and it may be since the standard curve is non-linear (but I didn’t have enough HMM to do a standard). Importantly, this assay definitely detected HMM that diffused through this pnc-Si chip, although the digested HMM signal was the same and intact HMM. It’s possible that the HMM stock had degraded during this experiment and diffused through similarly to digested HMM. This is a major issue to work out, HOWEVER, this is the first time we definitively demonstrated HMM diffusion through a pnc-Si transwell.
How does one conclude that the limit of detection is lower for Quant-IT based on the curve that is shown here? The sensitivity actually looks lower and the detection limit is unclear.
Was this concluded somewhere else? I can’t find it on the blog.