Hemo-Dialysis Channel Flow Characterization
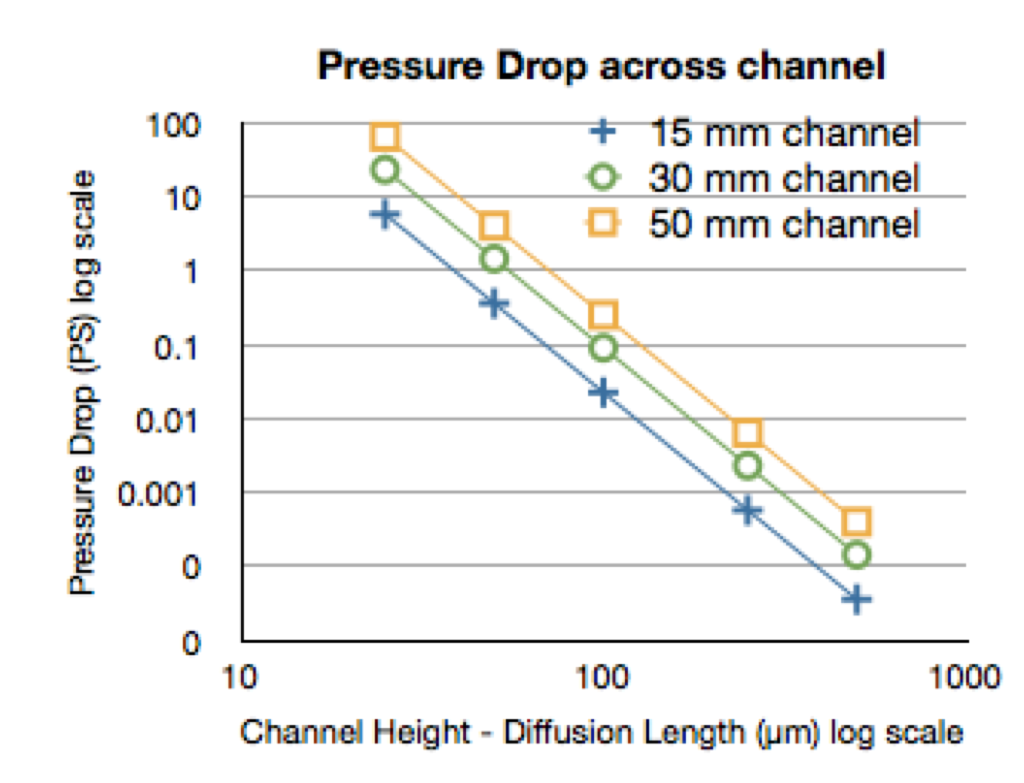
Dialysis Rate: 10 mL/min, Péclet Number: 1, Membrane Width: 700 µm, Channels per chip: 17
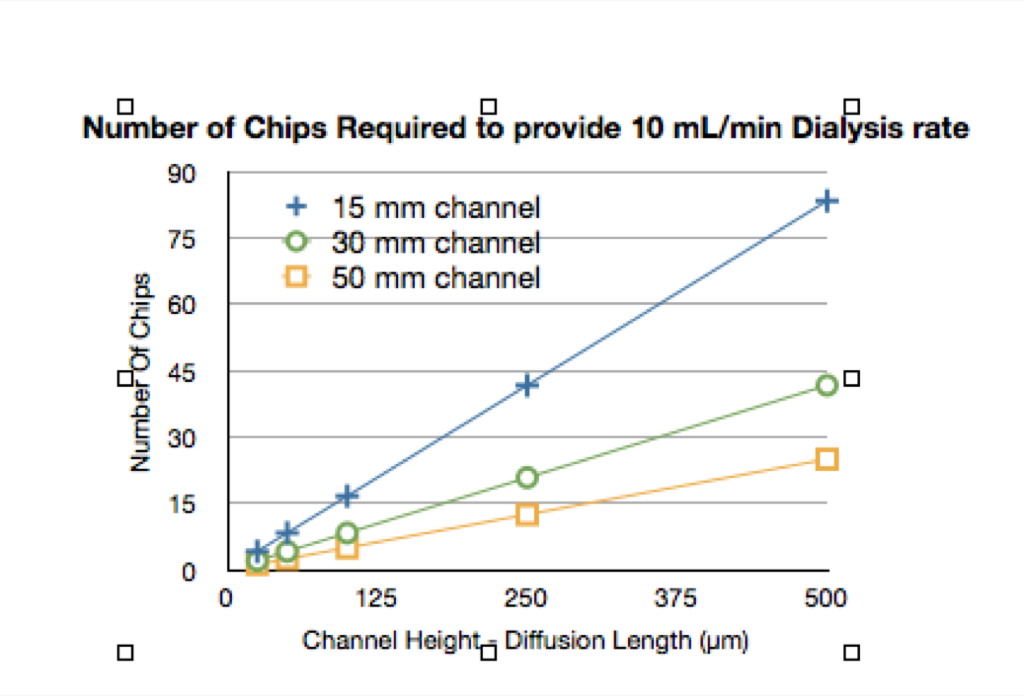

Péclet number
Pe ∝ H
Pe ∝ 1/L
Pressure Drop, P
P ∝ 1/H3
P ∝ L
Dialysis Rate: 10 mL/min, Péclet Number: 1, Membrane Width: 700 µm, Channels per chip: 17
Péclet number
Pe ∝ H
Pe ∝ 1/L
Pressure Drop, P
P ∝ 1/H3
P ∝ L
I few weeks ago, I had a couple wafers made with different size squares and slits. I posted my first results here and here. In that experiment, I showed pretty dramatic 2D structures over both supported and free-standing membranes with rectangle shapes. Also, I showed vacuole formation at (almost) the single cell level on square…
I used COMSOL for finite element analysis (FEA) modeling of EOF and DEP at a microporous membrane in a PDMS microfluidic channel. Effects of two parameters were determined: Membrane thickness, and spacing between pores. The modeled membranes had a 25×25 um surface, and a thickness of either 100 nm or 500 nm. Pore diameter was…
video (this version is saved to the server. It’s smaller and blurrier) http://www.youtube.com/watch?v=2JZ8uTWhejs&feature=youtu.be (this version is private – it can only be accessed by people with the exact link – it’s high quality) I modified the bottom basket of a Sepcon by drilling a small hole into it. A Sepcon chip with an average pore size…
Overview I burst pressure tested TEM chips with 1×1 mm windows of 100 nm SiO2 that were both annealed and unannealed (provided by JP and Josh Miller). In our experience it seems that the forming gas (H2/N2) annealed chips are stronger and never wrinkle. These burst pressure tests were performed in an attempt to…
One question we recently had was what does it look like when we perform a separation experiment when a membrane has a pinhole. I selected two membranes off 621 that appeared to have pinholes on both slits. I applied 1:2 standards to the top and allowed to diffuse for 24 hours. I collected the retentate…
In a previous post I had shown the relative fluorescence of various substrates as normalized to glass. 1um beads (either green or red) were placed onto each surface and imaged with constant EM Gain, exposure time, and intensity. Bar graphs were constructed to show the relative fluorescence (red and green were not normalized to each other)….