Updated Hydraulic Permeability
last week I ran some tests using a single 100K microcon filter; this week I preformed essentially the same tests but instead of testing one filter over the entire pressure range I used a new filter at each pressure. I tested the permeability at 1.35psi, 21.63psi, 118.7psi, and 267.1psi; each pressure was tested using three “fresh” 100K microcon filters.
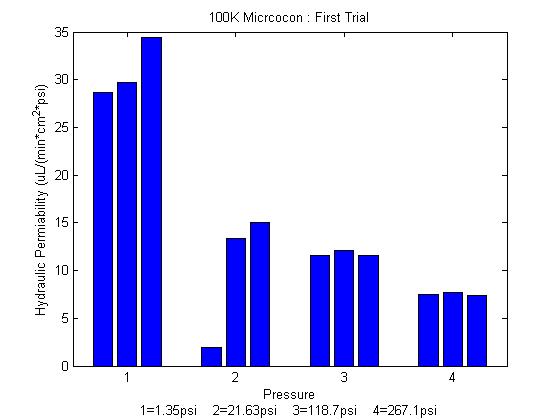
The bar plot above shows the initial trial of each set of filters at the specified pressure. Once these tests were completed the process was repeated to see if the hydraulic permeability changed with successive tests of the same membrane.
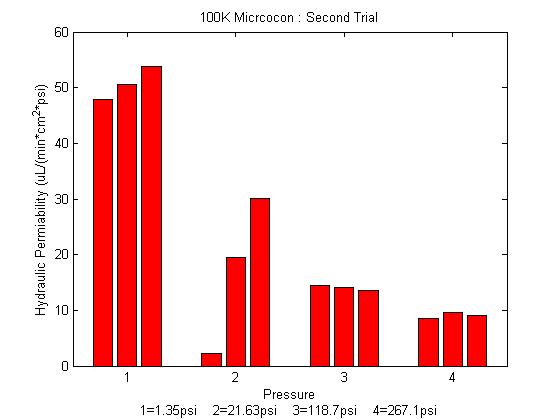 As shown, for every 100K microcon run a second time the hydraulic permeability increased. This is most likely due to the membrane already being wet as a result of the first test.
Looks pretty definitive Mike. Well done.
We need to run with protein to see if flow rates drop and we need to see what happens in a wet-wet format.
Doesn’t this contradict the previous experiment that showed a degradation in flow rates with successive spins? Please clarify how these results can be compared to the previous posting.
Also, at the second lowest pressure, one device has much lower permeability than the others. What is different about this device, and could it really be a 50K device accidentally mixed in? Have you observed such a large variation previously? Is it possible that 10% of these devices are duds? It would seem to me that if you were running an important separation process with expensive protein, it would be a serious problem if you happen to use a device with substantially different characteristics. I wonder if this effect extends beyond the permeability.