Alexander Shestopalov’s Group Update1: Silane with PEG4 and PEG8 Samples
In this post, I’m going to discuss the results of the different PEG molecular on silane samples. We used same condition to make 4 chips for each sample. And we treat them with BSA, IgG, and PBS to rest the adsorption. We are using the SEM, contact angle and XPS as the testing method.
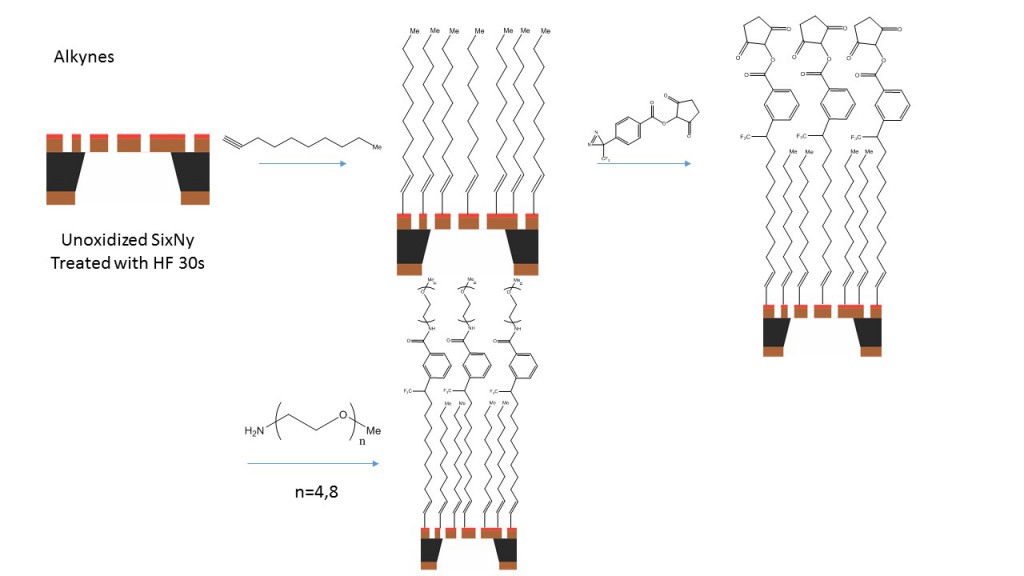
The way we are using to synthesis the PEG on the silane samples shows below:

We are using two different PEG which is PEG4 and PEG8 with NHS functional group which can be react with the amine group on the silane sample surface.
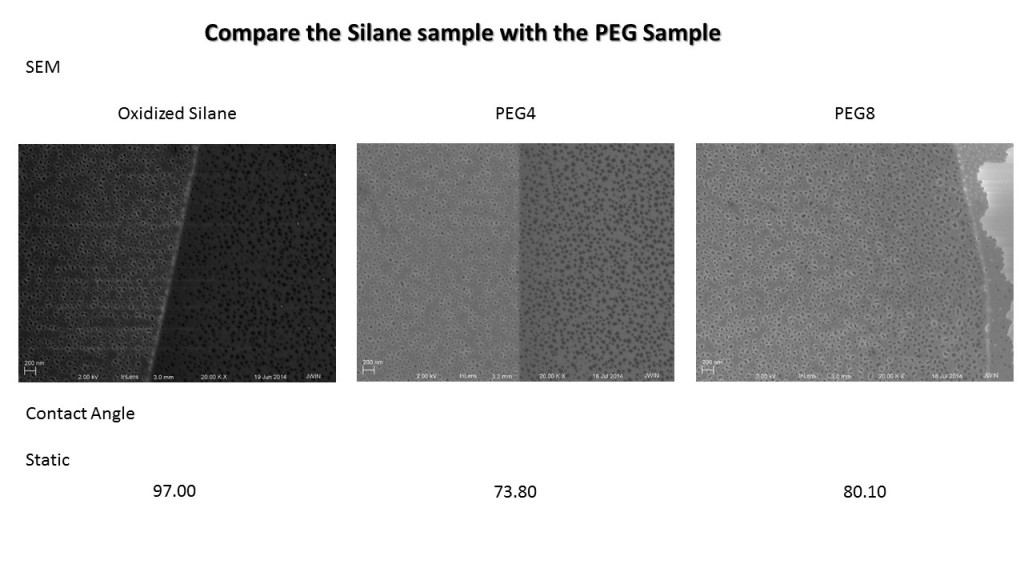
SEM and Contact angle
First, we compared the SEM on the original samples without treat any protein or buffer. After we synthesis the PEG on the surface, the surface nanoporous remain same with the silane Sample. And the static contact angle show us both PEG4 and PEG8 become hydrophilic.
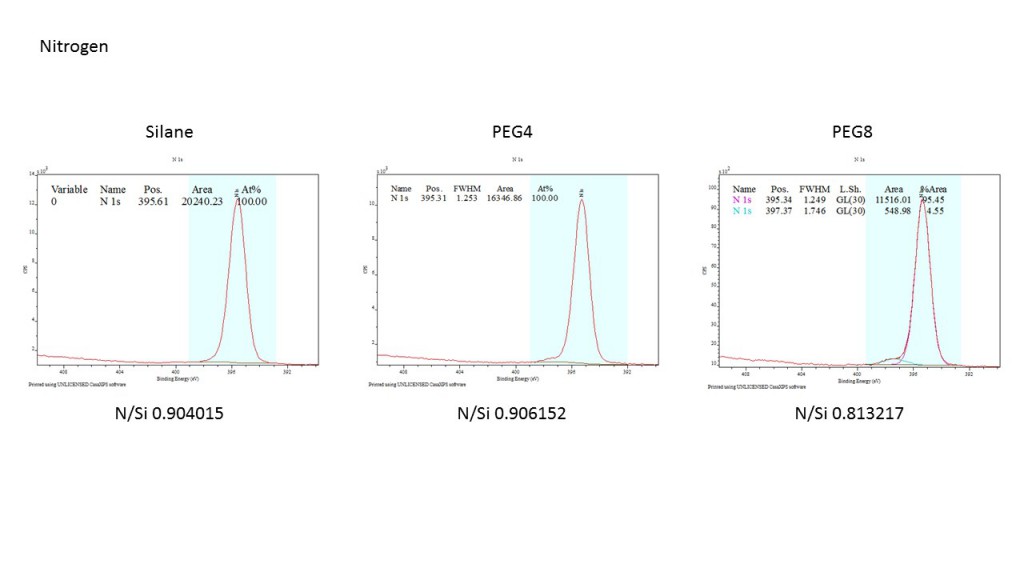
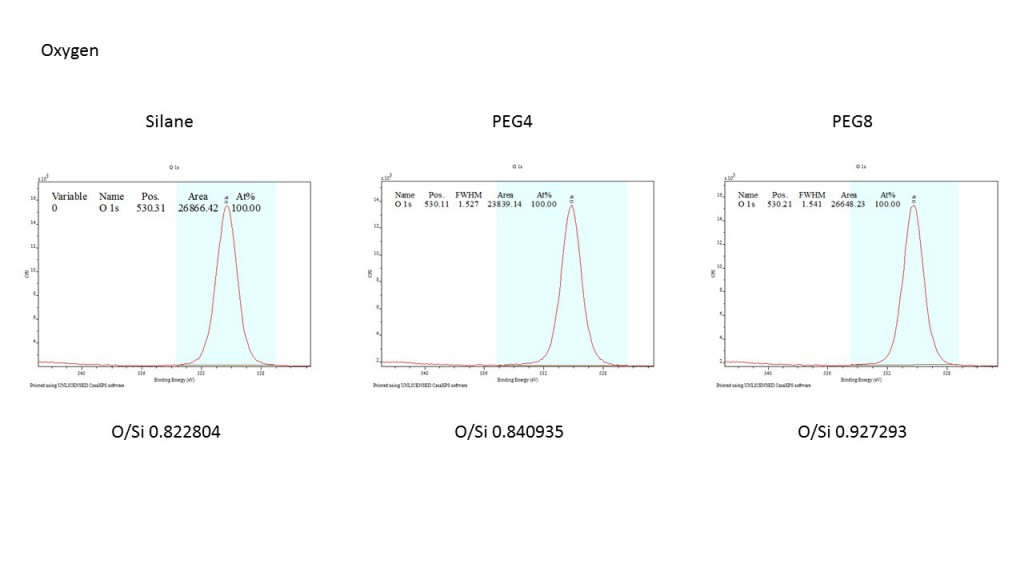
XPS
The N peak keep the same and the ratio of O/Si increased a little bit in PEF4 and PEG8.
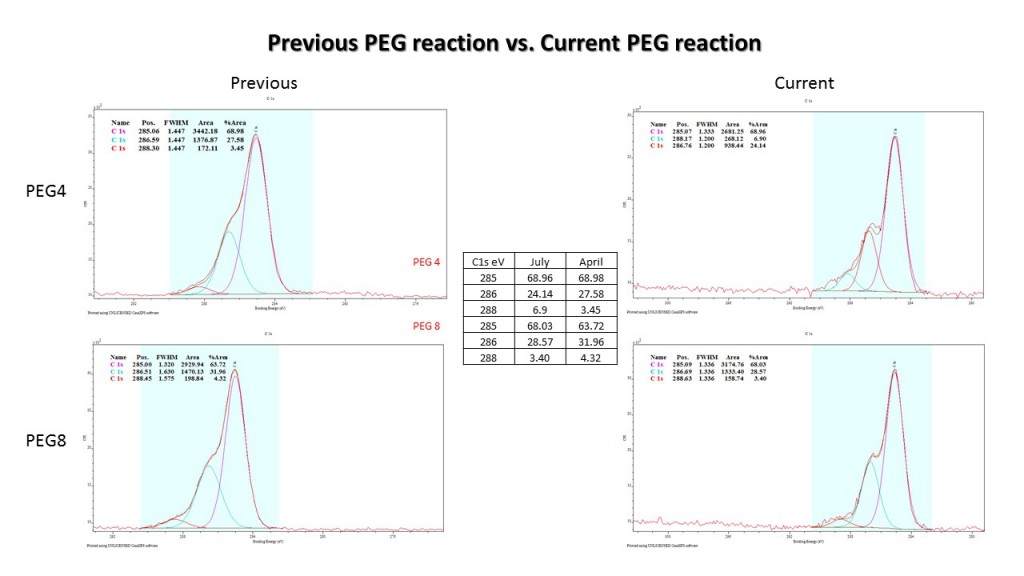
For C peak, we can clearly see that the C 286 peak are going up both in PEG4 and PEG8 and there are one more smallest peak appear in PEG4 and PEG8. These data show us the PEG reaction is successful.

We also compared the current sample’s data with the sample which we made in April. It shows us the C 286 peak is almost same between April and July’s samples which confirmed the success and constancy of PEG reaction.
For the AR-XPS, we can see as the angles goes up, all the three samples shows the same way: the N to Si ratio are going down and the C to Si ratio are going up which show us there are more carbon on the surface and less N. The O/Si ratio at each point in PEG4 and PEG8 are higher than the silane sample and with the position closer to the surface, the O/Si ratio in PEG4 and PEG8 growth faster than the silane sample.

Protein adsorption
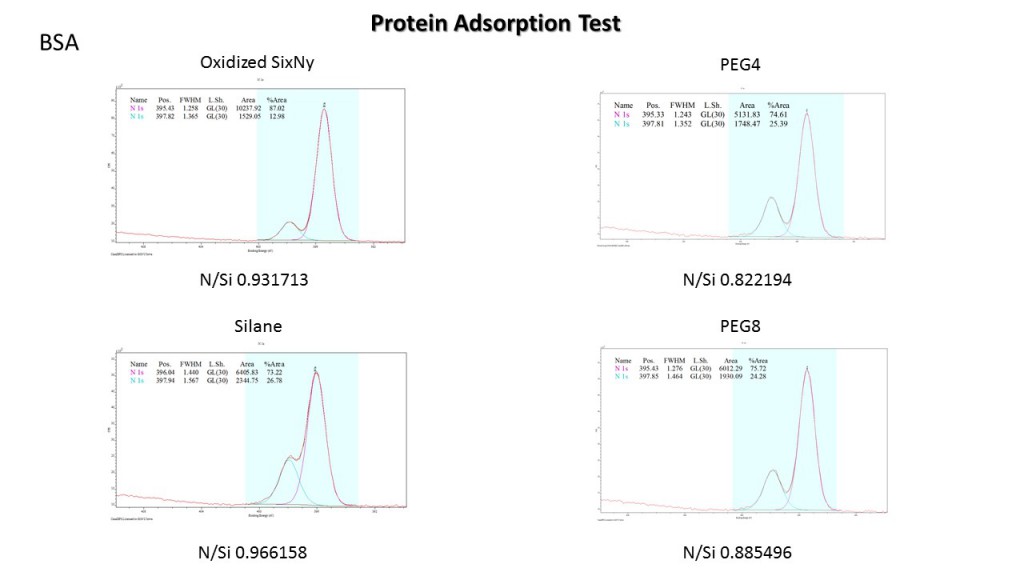
Next part, I’m going to discuss the protein adsorption BSA and IgG in four samples: Oxidized SixNy(As Ox), Silane, PEG4 and PEG8. We are using the PBS as the control group. This time we divided the N peak into two different peaks: small protein peak and main peak.
For the BSA, we can see both four samples adsorb the protein. The PEG4 and PEG8 clearly protect the surface from the protein because the percentage of the protein peak in PEG4 and PEG8 are 25.39% and 24.38% compared to the 26.78% in silane.
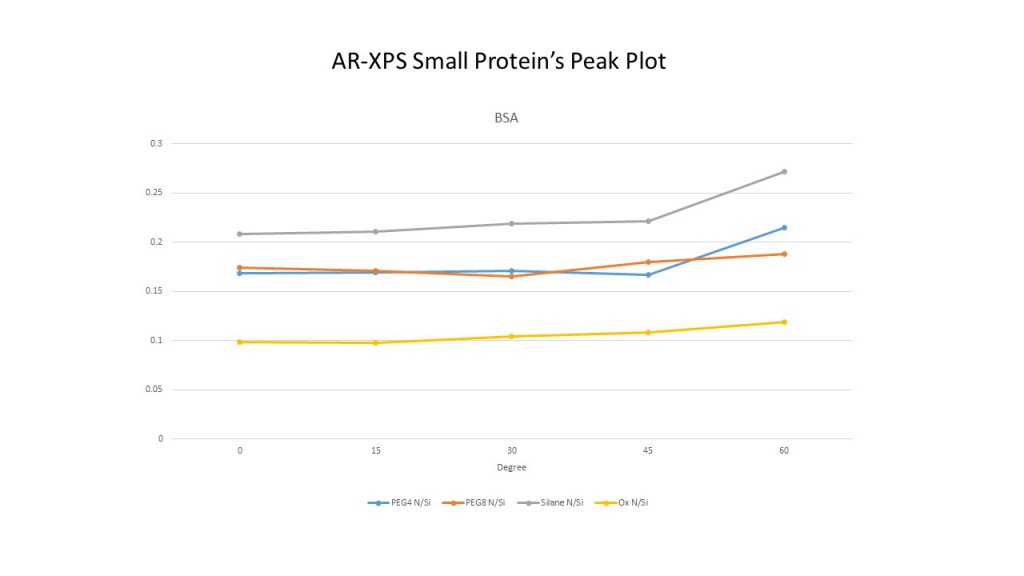
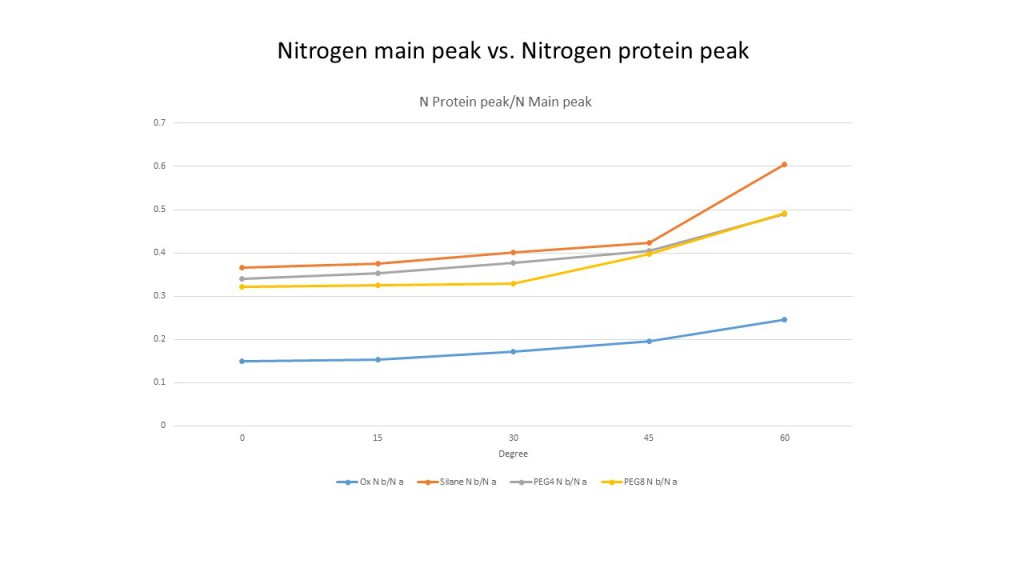
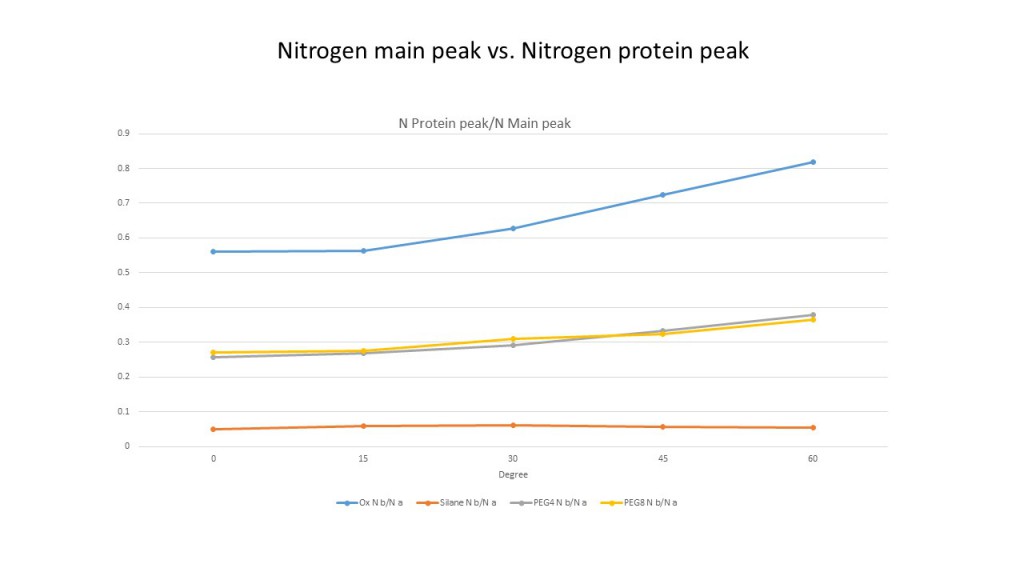
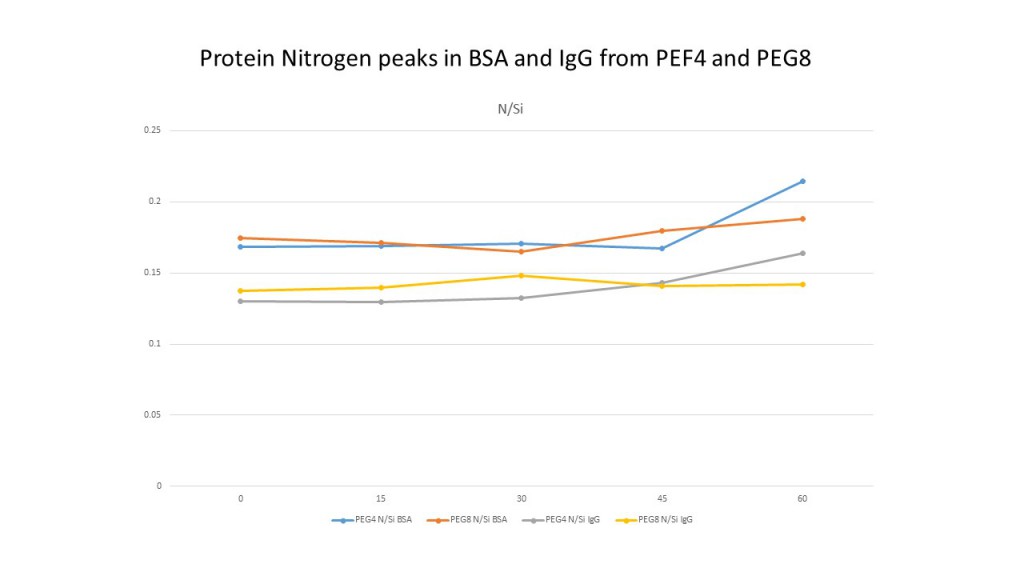
And it is more clear that if we compare the ratio of protein N peak with Si peak in dour samples. We can see that in each point, the protein peak ratio in PEG4 and PEG8 are lower than the silane. It decreased about 20% at 0 degree and about 30% in 60 degree in PEG8. But the ratio is still higher than the Ox sample. We also compared the protein N peak with the main peak in each sample. It shows us the same results.
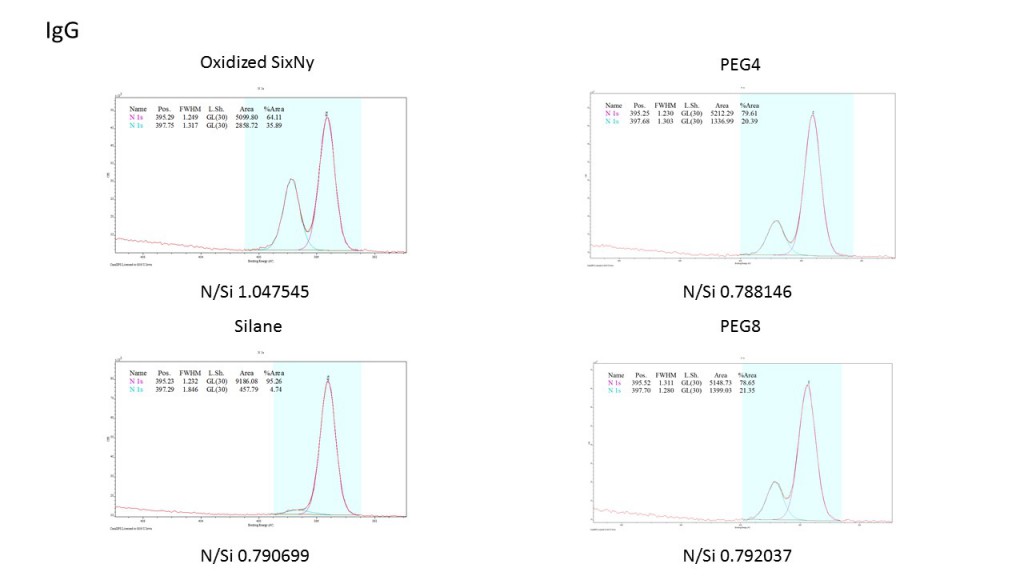
In IgG, PEG4 and PEG8 will adsorb the protein but they’re both lower than the Ox sample which is 20.39% (PEG4), 21.35%(PEG8) and 35.89%(Ox). But the silane sample will not adsorb the protein.
Again, we compared the ratio of protein N peak with Si peak in four samples. We can see that in each point, the protein peak ratio in PEG4 and PEG8 are much lower than the OX. It decreased about 50% at all degree in both PEG4 and PEG8. But the ratio is still higher than the silane sample. We also compared the protein N peak with the main peak in each sample. It shows us the same results.
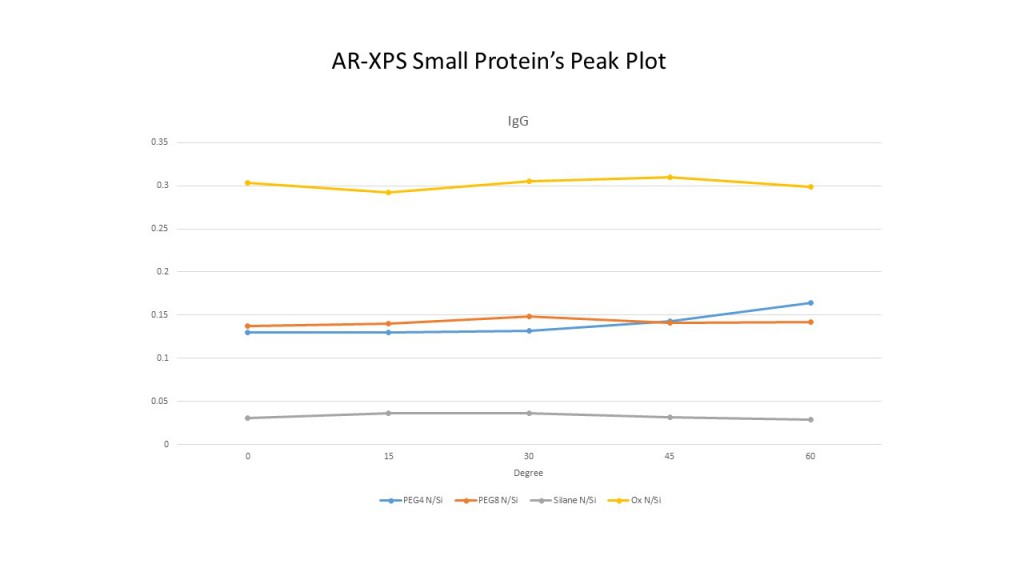
We also discover that the ratio of protein N peak with Si is almost same in BSA and IgG. It seems like the PEG can protect the surface with the protein adsorption no mater what kind of the protein is. From the slot we can see that, the ratio is from 0.13 to 0.2 and 4 lines are really close to each other. And it also seems that the PEG is more successful to protect the surface in IgG. In BSA, it is about 0.5% higher than the IgG in both PEG4 and PEG8.
The PBS data shows the same pattern in the original sample.
Future Work
These results are rather discouraging. One expects excellent hydrophillicity and low protein binding with PEGs. Instead the PEG treated surfaces are still rather hydrophobic and the control groups are the best surfaces in both the case of BSA and IgG.
Would it be worth it to run a control for BSA and IgG on a glass cover slip? Or some similar test to see what signal we should expect from a “purer” film of BSA or IgG?
I’m not very familiar with the contact angle measurement. When measuring contact angle, are the water droplets small enough that the broken membranes do not interfere with the outcome?