Total filtrate volume vs concentration
The following plot is an attempt to summarize recent work measuring rate of flow through a membrane as a function of concentration. We investigated 100 nm NPs, (totally blocked), 20 nm NPs (partially blocked) and IgG (mostly passed). In all cases, the buffer used was 1xPBS and 0.1% Tween 20. This plot mostly shows the total volume of filtrate after forward centrifuge for 5 minutes. There is also a line showing the results of a constant pressure test. The filters all came from wafer 1085. (~70 nm, 26% porosity)
(I calculated the concentration assuming 1 mg/mL IgG is equivalent to 4E15 parts/mL)
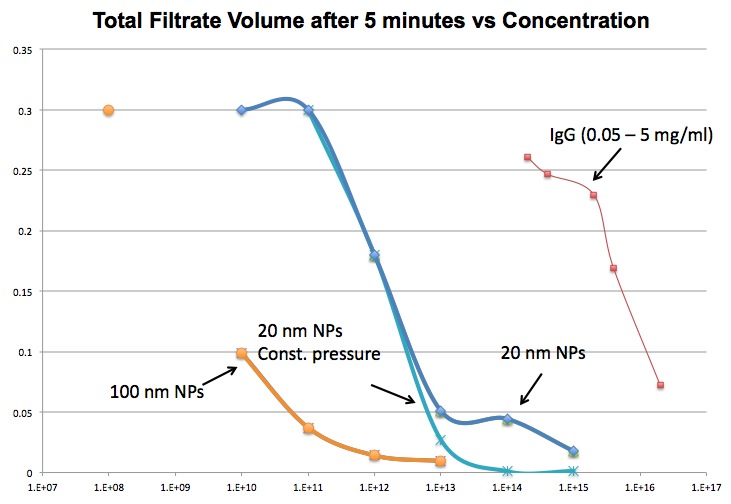
100 nm particles lead to blocked flow at lower concentrations than 20 nm NPs. IgG flows more freely than the particles but flow is still reduced once concentrations reach 1-5 mg/ml.
Updated:

The plot above is yet another take on this. I tried to determine the potential number of “displaced” particles by multiplying the filtrate volume by the concentration. So if all particles were blocked as in the case with 100 nm, I would have naively guessed that the filtrate that flowed through the membrane would have contained a number of particles equivalent to the number of pores. That is not happening.
Updated again!
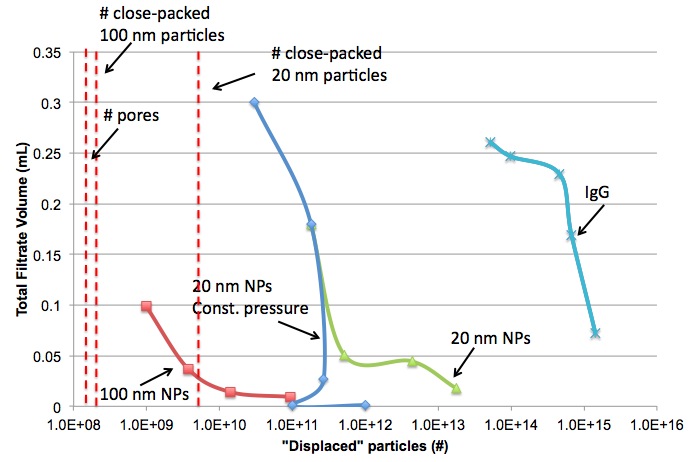
Plot using Jim’s suggestions in the comments below. I’ve also added vertical lines indicating the number of 100 nm and 20 nm particles you could fit on the active membrane area.
I love this figure. I especially like that it shows a critical concentration around 1 x 10^13 where the pressure cell fails to work but the centrifuge still gives flow. Beautiful.
Please run the constant pressure cell with the protein and 100 nm particles to complete the story. This addresses the question: does the size of particle matter in determining when one mode fails and the other works?
Can you calculate the number of pores vs. the number of molecules in these experiments? Same data, just multiple the concentrations by the starting volumes.
I get that 1 mg/ml IgG is 6.25 x 10^15 #/ml. Which dot is 1 mg/ml on the IgG curve? What did you use for the MW of IgG?
I found this website, http://www.piercenet.com/previews/2014-articles/calculate-number-of-proteins-per-agarose-bead/ , and used their calculated 4.01E15 IgG per mL. They used 150,000 g/mol for a MW of IgG.
1 mg/mL should be the second from the right on the IgG line. The highest value all the way to the right is 5 mg/mL.
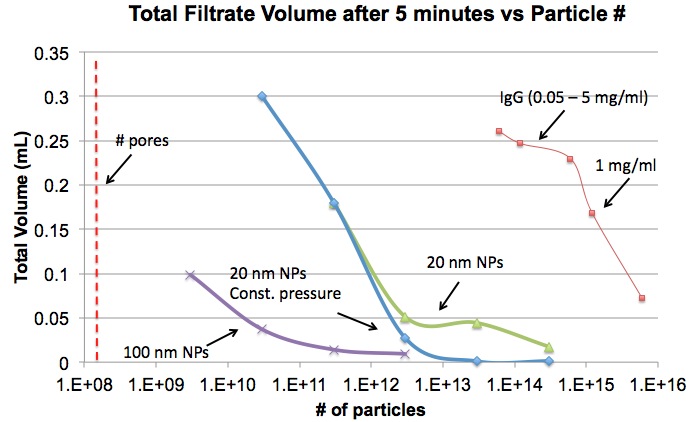
The pore density is 7E-5 pores/nm2. For a total active area of 1.5 mm2, I calculate 1.05E8 active pores. I’ll add the plot as a function of particle number instead of particle concentration to the post above.
Great.
Next up … Multiply the volume of filtrate passing in 5 minutes times the original concentration of particles. This will give you a new particle number that represents the number of particles that have hit the membrane during filtration (either passing through or getting trapped). This should shift the curves to the left and change their shape (they should get more vertical). I wonder how the vertical line representing pore # lines up with these values.
Oops I didn’t see the last figure. Try my plot to see if it makes more sense. The horizontal axis would be what you are calling ‘displaced particles’ and the y axis is still volume passed.
The other # to compare the ‘displaced particles’ to is the number of particles that could pack on the total membrane surface area (including pores). Assume hexagonally closed packed particles. This is what one would expect if a ‘cake’ was slowing flow rather than individual pore clogging. I bet this number lines up better with the 100 nm particle data.
Also did you mislabel the 20 NPs on the last plot? Its strange that the curvier curve is the constant pressure curve.
I added the suggested plot. I also added a rough estimate of the number of particles necessary to create a monolayer across the active area of the membrane. I double checked the labels and they should all be correct.
The porosity is 25%. So if the particles and pore sizes were the same size, it would take 4x as many particles to cover the membrane as it would to block all the pores, right? Then why does it take 1000 more 100 nm particles to cover the membrane vs. covering the pores.
Excellent point! I’m not sure if I just typed in the wrong number or what, but I recalculated assuming each sphere took up a square with the side length equal to the diameter. For example: # 100 nm NPs on active membrane = 1.5 mm2 x 1E12 nm2/mm2 / (100 nm)^2 = 1.5E8 NPs. I’ve updated the plot above.
I think hexagonal closed packed covers 90% of the total area …
http://en.wikipedia.org/wiki/Circle_packing
For both the 20 and 100 nm particles. Can you please add two concentrations lower than what you’ve tested? There should be a concentration below which the flow is independent or at least more weakly dependent on the ‘displaced’ particles. The protein already shows this.
I’ve updated the first plot to include some of the lower concentrations that passed completely through the filter in 5 minutes. (I have data for 100 nm at 10^9 but only at 5 krpm. I will need to double check a some points, but I don’t expect the general shape of the curves to change much)
Also, the filtrate volume maxes out at 300 uL because that is the total volume used in these experiments. So there is some error in claiming that 300 uL passed after 5 minutes, because the value could have been higher if we had started with a larger total volume.
I will update all of the plots with this data once I verify the points discussed above and acquire constant pressure data for 100 nm NPs and IgG.
I’m trying to pace myself here but I simply can’t.
Can you add gold NPs to this lovely piece of art? The densities are going to be below the # of pores and yes 100 nm and 20 nm would be most interesting.
Hang in there … This is going to be the great unifying figure of modern science – at least for the 6 or so people who care about NPN separations in SepCons.