Model curves for TE, graphene, and SiN membranes at various pressures
After correcting a minor error in my code that was giving me some weird limiting behavior, and optimizing the code to give me faster results, I generated the following curves:

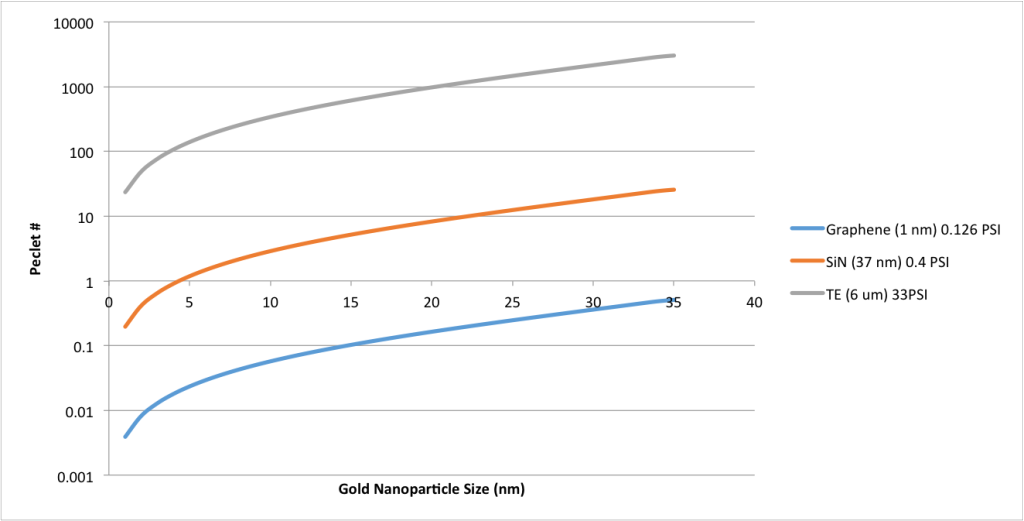
Note that, as experiment predicts, the ‘sharpness’ of the graph increases with increasing applied pressure. The model isn’t exact, and slightly underestimates the actual sieving coefficients, which I believe is due to the fact that the model currently uses a uniform distribution of pores. The next iteration will use a TEM-image-based distribution. Next, I plotted the peclet number of each of the three model curves.
In the following graph, the y axis is the peclet number, x axis is gold particle size in nm, with the same range (0-40 nm) as the others:

Note that the peclet number is only below 1 for very low pressures and very small particles.
Next, I used the model to predict the sieving curves for three different membranes, all with 37 nm pores. Graphene was assumed to be 1 nm, SiN is 50 nm, and TE is 6 um. Pressures were chosen so that the flux through the pore was the same in each case. This means graphene had a pressure of 0.126 PSI, SiN was 0.4 PSI, and TE was 33 PSI.

Note that graphene is sharper than SiN and TE, and that SiN and TE are essentially indistiguishable. The reason for this can be seen in the peclet numbers graph below:
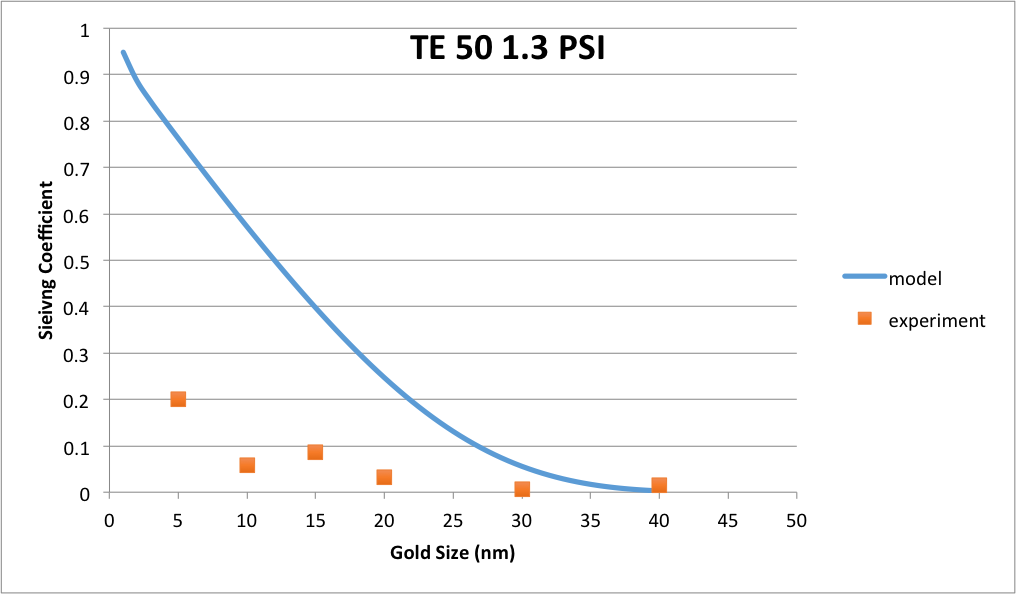
A final data and model set, this one for TE 50 nm membranes at 1.3 PSI. I think we’re losing gold because of the geometry of the system I’m using. This data is still a work in progress.