Where pnc-Si Separations Fall on the Zydney “Robeson” Plot
In the field of gas permeance there is a plot called the “Robeson Plot” (the paper that debuted it) that is used to compare the separation behavior of various membranes made of different materials and measured in different systems. An example is pictured:
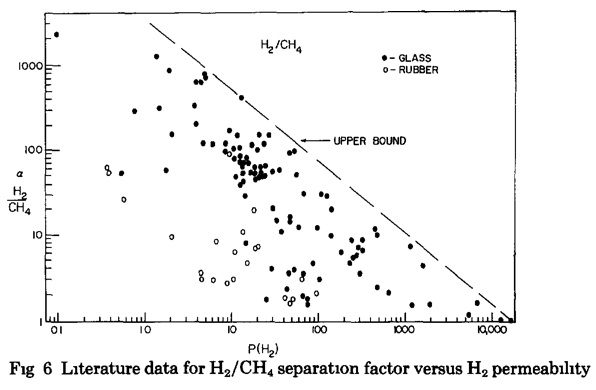
Various literature data for the log permeability of H2 gas versus the log inverse sieving coefficient of H2 and CH4 gives a pretty clear upper bound to performance – called the “line of death”. If higher flow rates of H2 are desired, that means there will be an increase in the amount of CH4 going through the membrane. (Rubber refers to membranes composed of natural rubber, and glass refers to membranes composed of glassy polymers.)
In 2004, Andrew Zydney generated an analogous plot (Zydney’s paper) so that different ultrafiltration membranes could be compared:

Instead of two different gas species, Zydney compares the transit of water and BSA. The ideal membrane would be up in the upper right hand corner of the plot, with very high hydraulic permeability and a high inverse sieving coefficient (which would correspond to a very low concentration of BSA in the filtrate). This data is all taken at the start of a separation, so that fouling of the membrane is minimized. Concentration of BSA is not given, which I assume means that concentration doesn’t matter for performance if fouling is ignored, but that’s something that I have to think about. The rest of the paper details some efforts to use charged membranes and low salts to beat the “curve of death” and get closer to the upper right hand corner.
We haven’t done many experiments probing the convective transport of BSA across pnc-Si or SiN (NPN? is that the new acronym for SiN?). I had some numbers lying around from March 2013 from two experiments I had done: the variable area experiments (data collected on BSA flow through pnc-Si chips with 5, 3, 1, or a half slot), and work to show that 10 nm EA-treated chips were appropriately size to allow cytochrome c to pass while retaining BSA. I did some quick calculations to find the hydraulic permeability and sieving coefficients in the two cases, and pictured below is where they fall on the Robeson plot:
Both separations were performed at 1 mg/mL BSA. We seem to be at the back of the pack, which is unexpected. It’s worth talking about why that is. I’d like to repeat these experiments, both with NPN and with some of the pnc-Si I still have lying around.