Auger Electron Spectroscopy: A Basic Overview
Since I am posting data that is acquired using Auger electron spectroscopy, I thought that it might be a good idea to write a post about the theory of the instrument, to better understand why this data is useful and relevant.
The Auger effect is a phenomenon in which an atom that is excited by an electron beam undergoes a relaxation to a more stable state. During this relaxation period, electrons that are excited by the incident beam are kicked off and collected as an image, while the vacancies that are left are filled by electrons of a higher energy level. A diagram of this process is shown in Fig. 1:
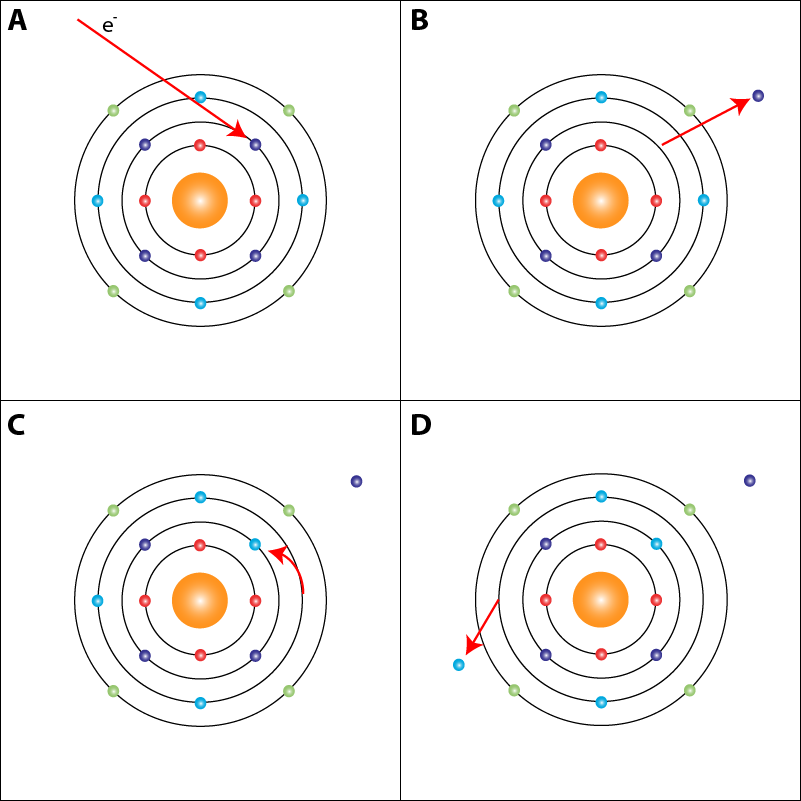
Figure 1: Theory of the Auger effect. A) The incident electron beam excites a layer of electrons in a certain valence shell of the atom. B) The excited electron is kicked off and collected by the SEM detector as image data. C) Electrons from a higher valency relax to fill the empty spot in the lower valence shell. D) In order to balance the valance shells, an electron must be removed. This is known as the Auger electron and is collected for spectroscopic analysis.
When the valence shells are balanced out, the secondary electron that is emitted in this process is collected by an electron detector. Because each element has different valances and an electron from these valences has a different energy depending on the element of origin, the electrons detected can be correlated to specific elements, giving very high resolution spectrographic identification.
One of the great features of Auger electron spectroscopy is the volume of analysis. This sets it apart from EDX in that the depth of analysis is only within the first 10 nm of the sample surface. So if we have a very thin film on the surface, Auger has the capability of detecting that layer with extreme precision that would otherwise be passed over by an EDX spectra (which has a sampling depth of up to 5 um). The sensitivity for lighter elements is also much better than an EDX analysis. Auger can resolve surface carbon and other elements, that would be ignored as background noise in the low end of an EDX spectra. Therefore, it would be possible to identify a phospholipid bilayer with Auger and show that there is a biological sample, not just residual carbon.
When talking about surface sensitive spectroscopy, it is important to not forget that we also have XPS and SIMS available to us. These are both very powerful instruments and can provide similar data to the Auger, but where they are deficient is in the fact that they both operate with a camera system to view the sample and define an area of analysis. This is very low resolution and it is impossible to really define small areas for analysis in these systems. However, an Auger system combines the imaging capabilities of an SEM with a high capacity spectrograph. Additionally, due to the sensitivity of the Auger effect, less analysis time is required, as background noise is cleaned up very rapidly and a highly detailed spectra is obtainable within minutes. This feature is not readily available on techniques such as XPS or SIMS, which generally have analysis times of 10s of minutes (approximately 30 minutes for an XPS spectra) and would make the analysis process longer. Fig. 2 shows a comparison between two spectra to demonstrate this feature:
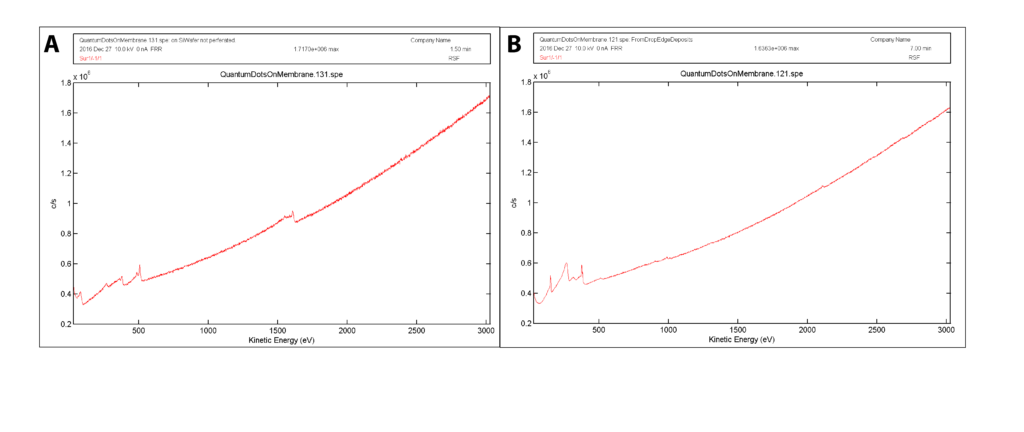
Figure 2: Comparison of two Auger spectra for smoothness of data. A) Spectra analyzed for 1.5 minutes. B) Spectra analyzed for 7 minutes. Note that there is enough background reduction for the spectra in (A) that most features can be detected at short analysis times.
Most spectrographic techniques have their own advantages and disadvantages and none is perfect, but for the application in which we are trying to spectrographically identify quantum dot labeled exosomes, Auger is perhaps the best possible technique. Auger has the SEM capability of a standard SEM and we can get an image of our sample. Then we can go in without moving the sample and get a high quality elemental composition of the surface features. This would allow us to zoom in on exosomes on the membrane, generate an SEM image and then take a spectra to show the elemental composition and finally run a map of the surface to show spatial distribution of the elements. Further posts will discuss data obtained on a Phi 710 NanoAuger system regarding a depth profile of magnesium fluoride membranes and a quantum dot Auger analysis.