Exosome Identification: Quantum Dot Labeling and NanoAuger Analysis
Alright, so this is kind of a big update and I will probably split it into a couple of parts. Basically, in a search for a way of confirming that the particles we are seeing on the membranes, I have tried several techniques with varying degrees of success. The initial experiment involved me conjugating an immunogold complex to the CD63 antigen that is found on the surface of exosomes. This is the most common technique of identification for exosomes, where the sample is analyzed in the TEM. However, our membranes do not quite fit into the TEM as they are just a hair too large. (Note though, Brian McIntyre and I are attempting to “bastardize” a TEM holder because the width of the holder is 5.4 mm exactly, so we can basically tape the sample to the TEM holder, but this could run the risk of the sample falling into the chamber and then Brian would have to disassemble the TEM to get it out, apparently not an easy process.) Therefore, for about a month, Brian and Ralph (a semi-technician in the UR Nano facility) worked on FIB lift-out of the membrane. The finally got the technique to kind of work and we were able to see what appeared to be exosomes with gold particles conjugated to them, but this was not very convincing (see my previous post on this here).
Then, I decided to try a fluorescent secondary antibody conjugated to the CD63, hoping to use Tom’s scope or our Zeiss, but the resolution was not high enough to discern more than a general fluorescence. Then, Jim had a suggestion based on some of the work that Marina is doing. She is conjugating antibodies to quantum dots and testing the performance of the NPN membranes in SepCon for separating the unlabeled antibodies and quantum dots. We thought that if we could conjugate my primary antibody to these quantum dots, then we could perhaps elementally show a distinction between the quantum dots in the SEM with a normal image (as the quantum dots are visible and smaller than exosomes) and show co-localization of the quantum dots and exosomes, even with a gold coating. I then thought, what if we could take this one step farther and do an elemental analysis to show a cadmium signal (from the quantum dots) next to a carbon signal (from the exosomes). This would be proof enough that if we could see these particles in the SEM and then show this elemental analysis, we can say that we indeed have exosomes on the membrane.
I immediately went to talk to Brian and he said that on our SEM, this would be virtually impossible. The EDX detector can pick up a cadmium signal from a collection of quantum dots, but individually we can not resolve the spectra (a point spectra is too large with EDX). Additionally, the mapping capability of the EDX software is limited in that it does not have drift compensation, which is vital for a sensitive map as the samples charge and the image drifts over time. He did say that we would be able to do this in the TEM, but because of the sample size, this was pretty much ruled out. A little chagrined, I went to think about how to approach this problem. XPS would be more surface sensitive (having a penetrating depth of 10 nm as apposed to the 5 um of the EDX beam), but the imaging resolution in XPS is quite literally crap. There is just a basic microscope on the system, which wouldn’t be able to resolve our particles. I though about then using an Auger electron spectrometer, but we don’t have one at UR. However, the lab that I used to work in for undergrad had just purchased and installed a brand new Phi 710 NanoAuger system (Fig. 1), which has the SEM capabilities of our SEM with the elemental analysis capabilities of the Auger (which is a highly surface sensitive technique, similar to XPS. See my post here about the theory of Auger electron spectroscopy.)
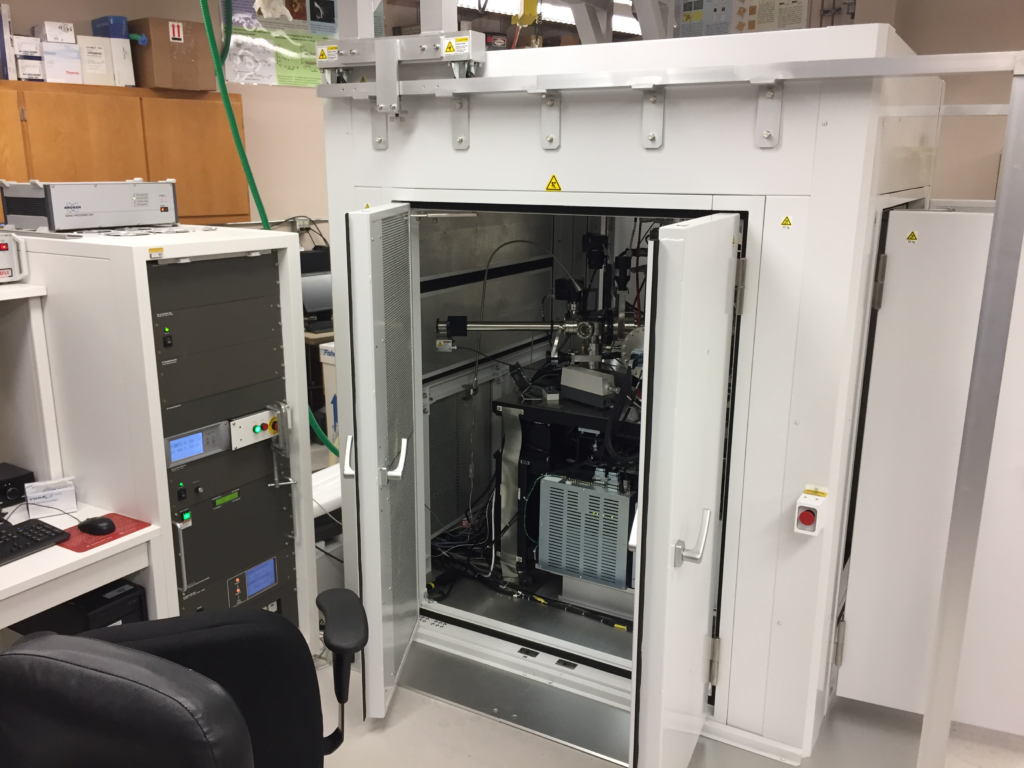
Figure 1: Phi 710 NanoAuger system. The instrument is protected with its own room that is soundproof, light proof, vibration isolated and thermally isolated. Bakeouts can be performed with no more prep than simply closing the doors.
If I could use this system to get the spatial distribution of cadmium and carbon (which an Auger is sensitive enough to detect, but EDX cannot), then I show this correlation and we would have a very good data set. So I became, as Jim called me, a madman and shipped some samples to MSU to be there for me when I arrived.
I borrowed the lab of one of my professors from undergrad (Dr. Ross Carlson, I believe that he deserves some acknowledgement here. If you Google him, I would put the Dr. prefix, or else you’ll probably find an article about a murderer, which is not him.) to do the conjugation of the primary antibody to the quantum dots. I had all my sample ready, and we were going to do the analysis, but there turned out to be a problem with the system. The anode on the electron gun was bent, so the imaging resolution was not at full capacity and we were unable to see features in the range of exosomes. This was a bit unfortunate, but it didn’t mean that we weren’t able to get data. In fact, the system gave us phenomenal data and showed how sensitive it truly is.
Given that the imaging resolution was not the greatest, what we attempted to do was simply dry some quantum dots on one of the membranes and do the analysis on that suspension. Figure 2 shows the SEM image of the droplet and the membrane area, with the areas of analysis outlined.

Figure 2: NanoAuger data of quantum dot droplet. The SEM image is hazy due to the bent anode on the system’s electron gun, but we can still distinguish notable features. The area analyzed in the blue square shows a clean SiN membrane, while the area analyzed in the red square shows evidence of quantum dots. Note in the comparison between the Auger spectra and the EDX spectra taken of the same area, the EDX does not pick up much cadmium, but the Auger spectra shows only the quantum dot signature and no background from the membrane.
The Auger spectra from the outlined areas are perhaps the best demonstration of the capabilities of the system. As we can see from the spectra from the area outlined in red, the Auger spectra shows us that we can detect only cadmium, sulfur, some zinc and some carbon and oxygen that are likely from the polymer shell coating the quantum dots. However, what is more important is the fact that we cannot see silicon or nitrogen in this sample area. This shows the lack of depth penetration for Auger analysis, which is a huge advantage for trying to differentiate between an exosome and a quantum dot via elemental analysis. If we can resolve the cadmium signal without picking up a silicon signal, then this is perhaps the ideal method to show that what we have on our membranes are exosomes.

Figure 3: NanoAuger EDX mapping data of the quantum dot droplet. There is nice distinction between the elements, but the overlaid maps in (B) show that there is still a silicon signal noticeable underneath the cadmium. All 8 maps in (A) and (C) were taken in a total time of 1 minute.
This technique needs improvement to justify that I can go back and get the data on this instrument, so I am working to see if I can show quantum dot labeling in the SEM at URnano. If I can show that there are particles that appear to be exosomes and quantum dots in the SEM here, then I believe that it will be time to go back and get this final data set. However, this is proving to be a difficult process, so it may take a while before I get this, which is unfortunate because it would be great to finally have this definite confirmation to move forward.