Parameterizing Nanovolcanoes
Having generated some tomograms of various Au, NPN, and MgF2 nanostructures in the past months, I should be able to parameterize these structures. I have many questions about how the nanostructures actually effect SERS performance. In general, we can use these methods to more accurately and precisely describe our nanomembranes.
Hypothetical Factors
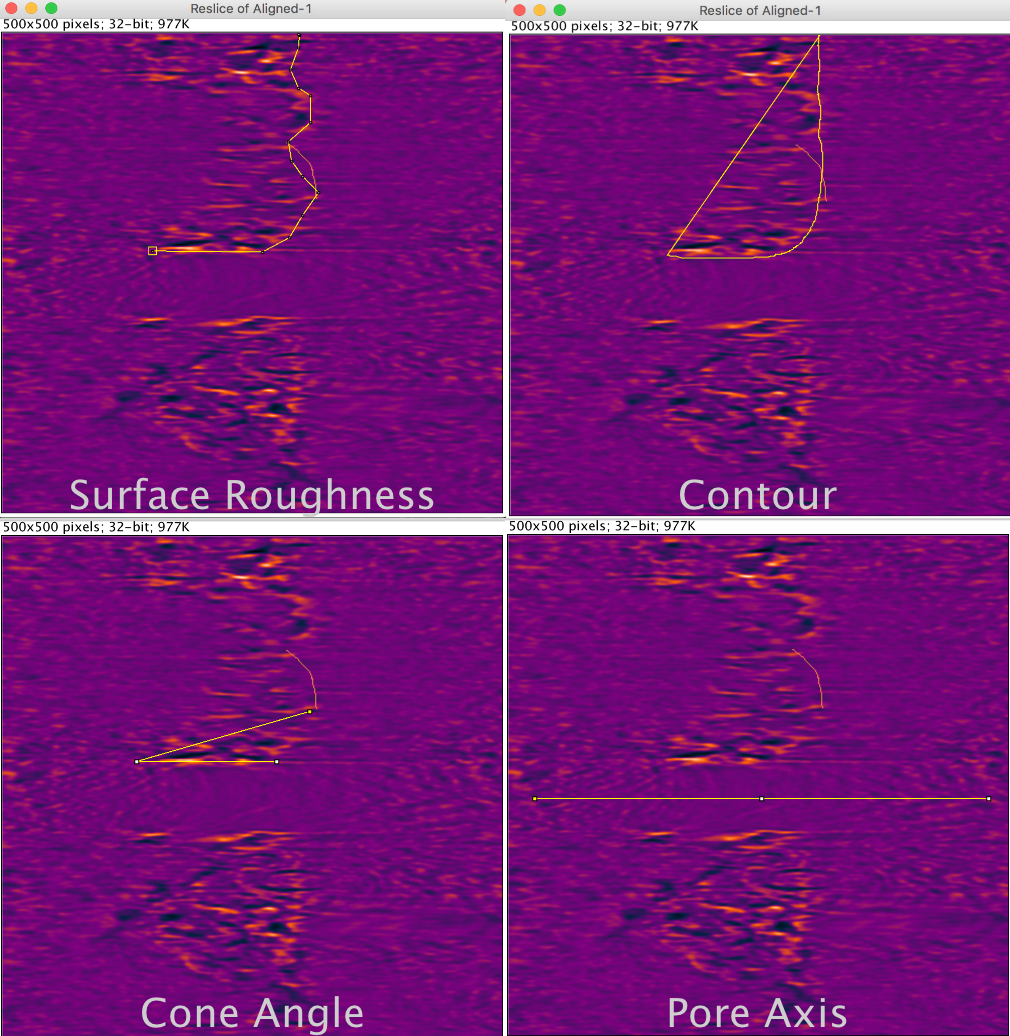
- Surface Roughness ~= Material
- Is MgF2 special? Evidence exists that NPN doesn’t have as nice SERS properties when coated with Au, but could we make it rougher with a different material/etching process?
- Modeled as some deviation from a fitted curve
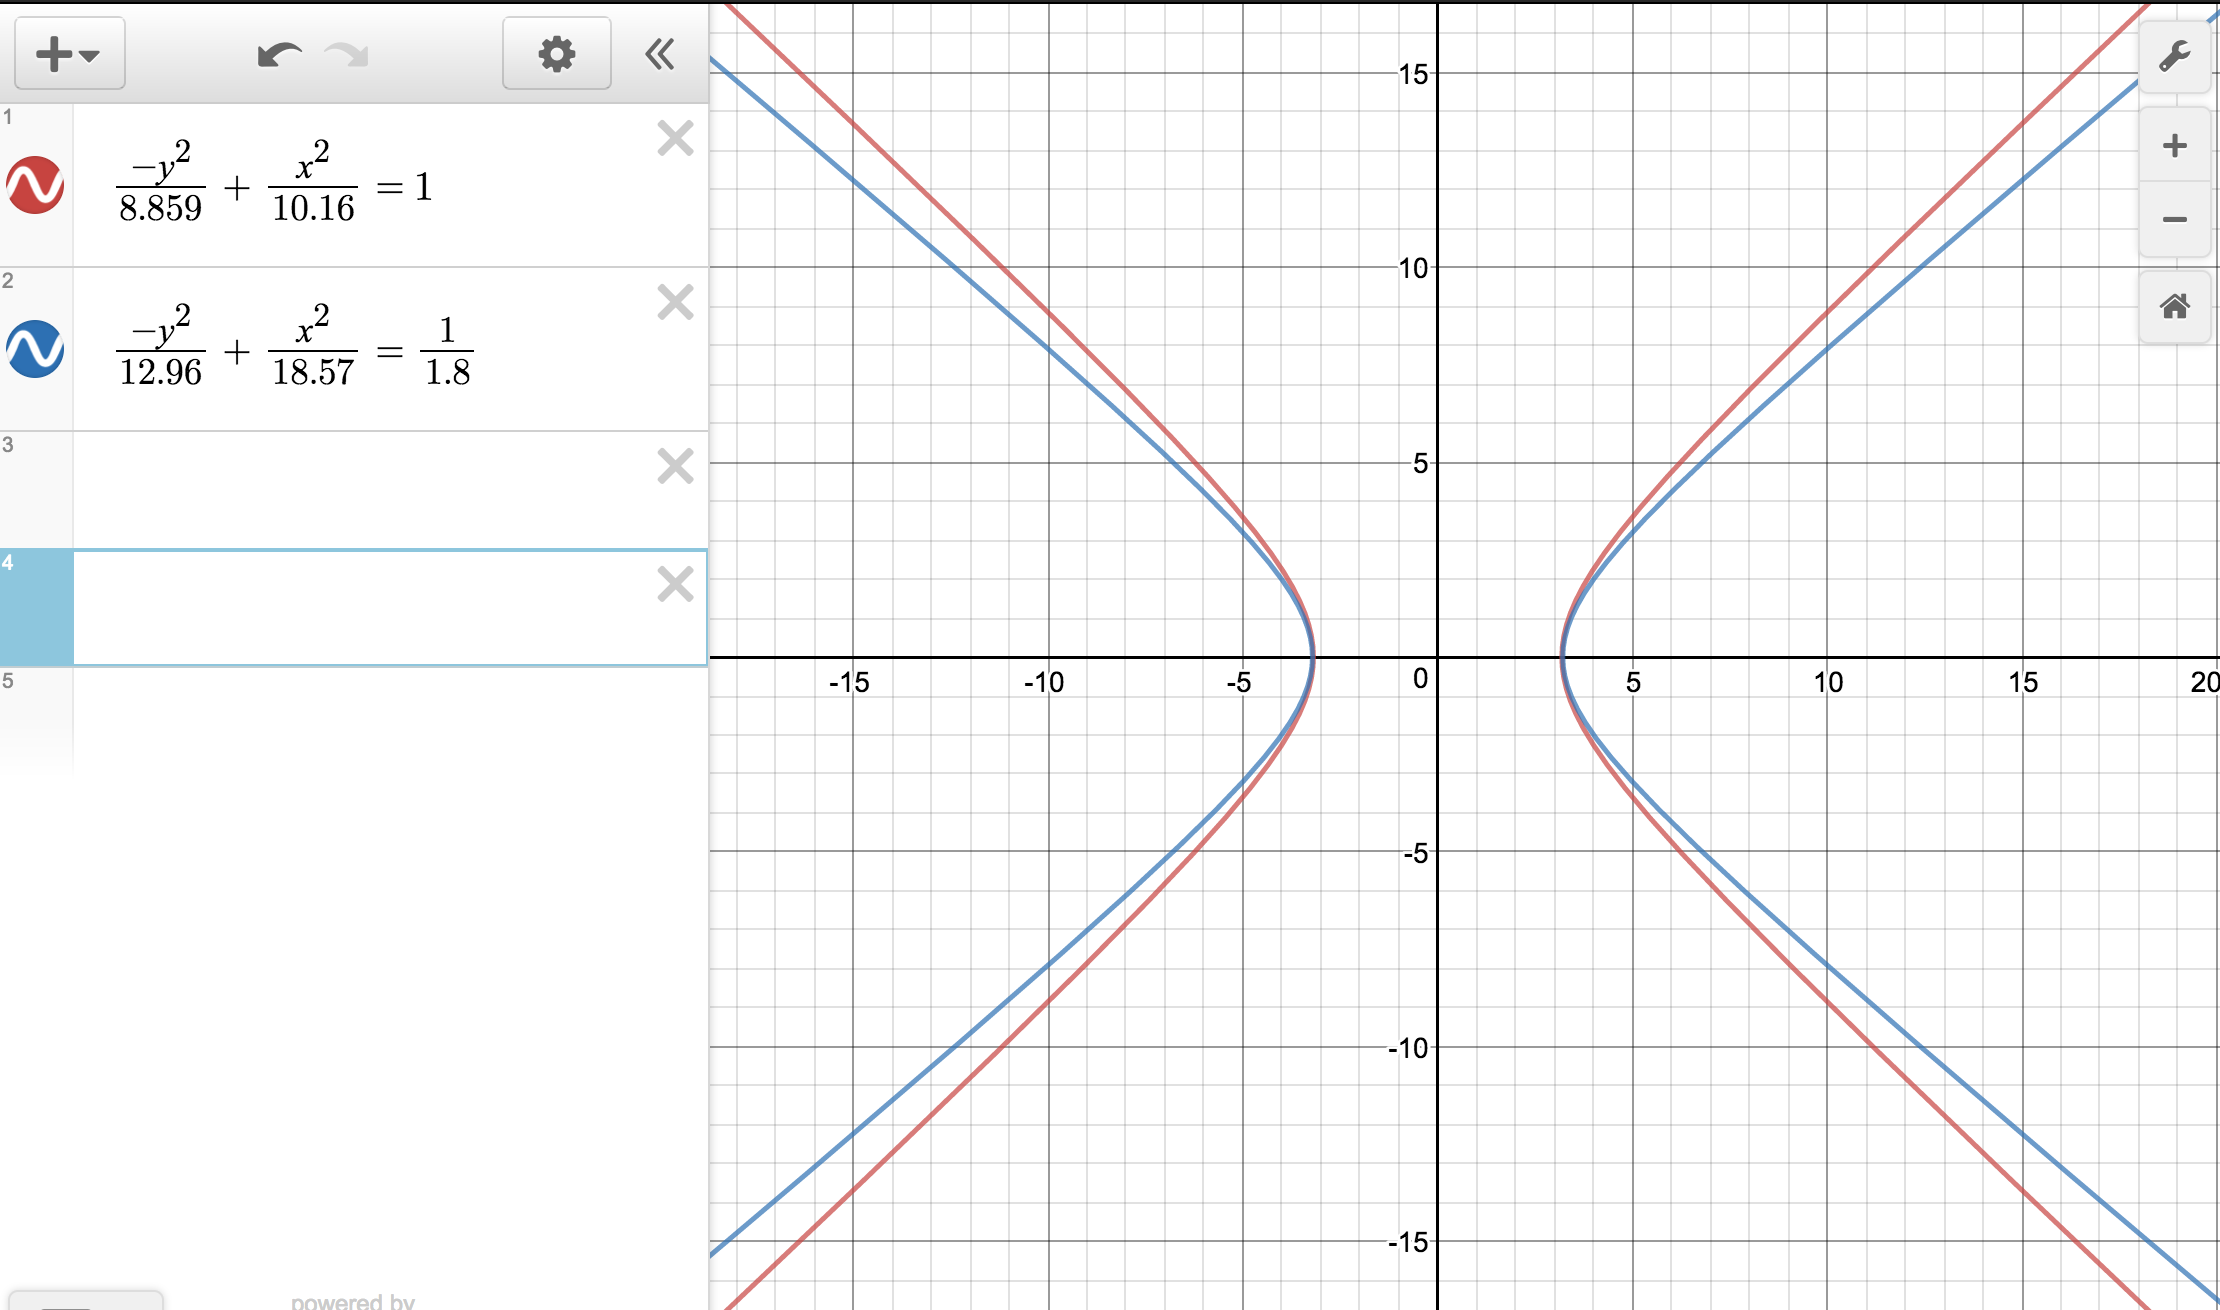
- Conicity
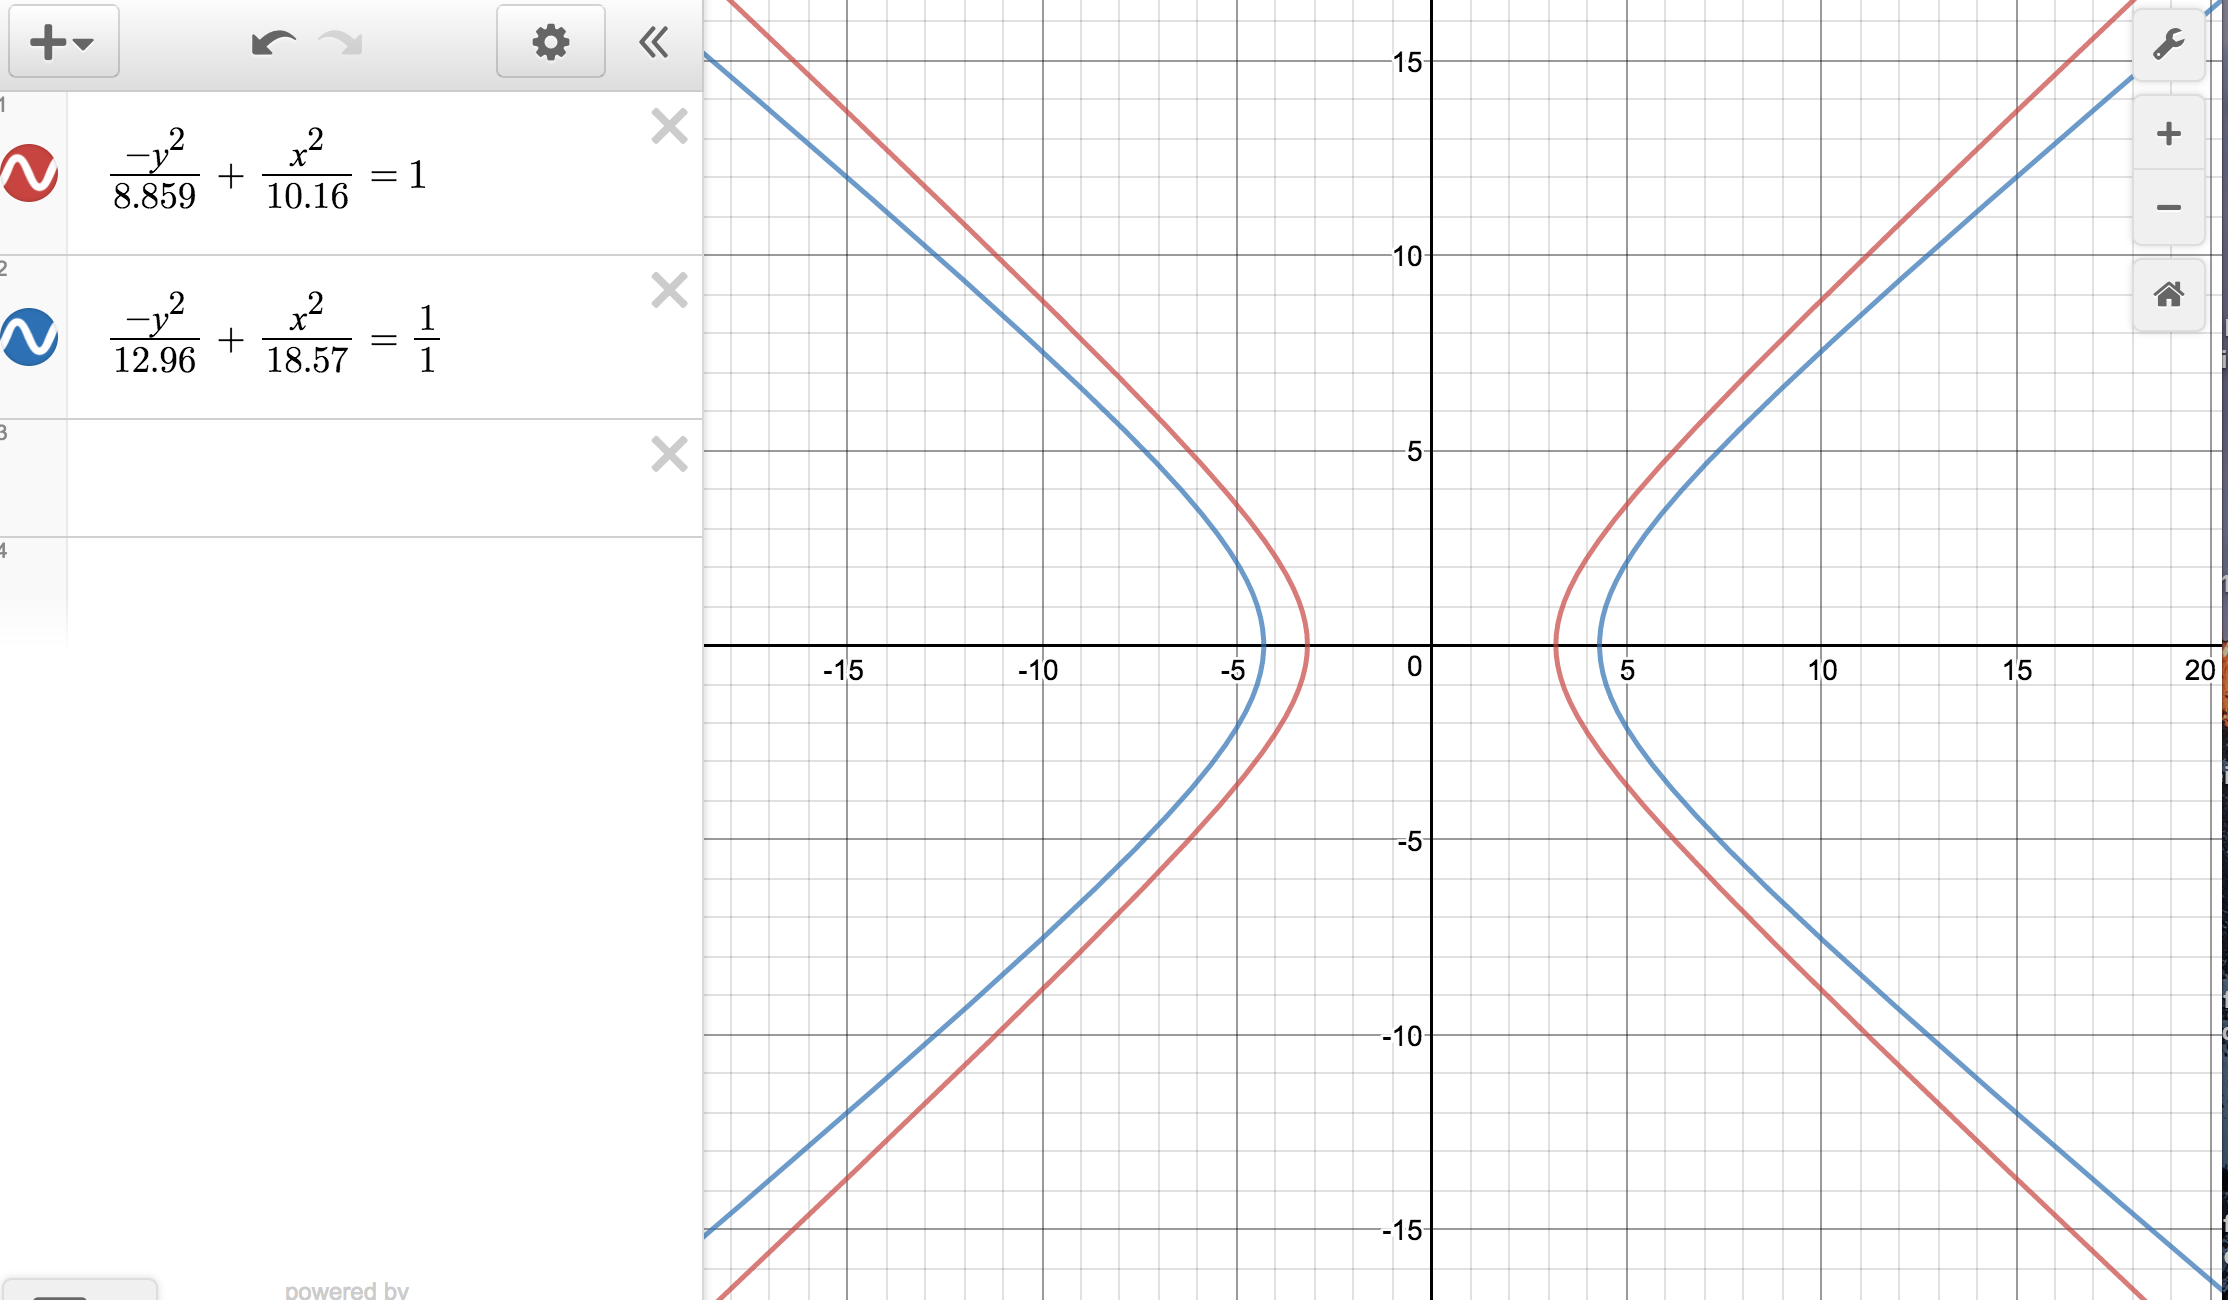
- Modeled as fitting to some hyperbolas, with some degree of fit.
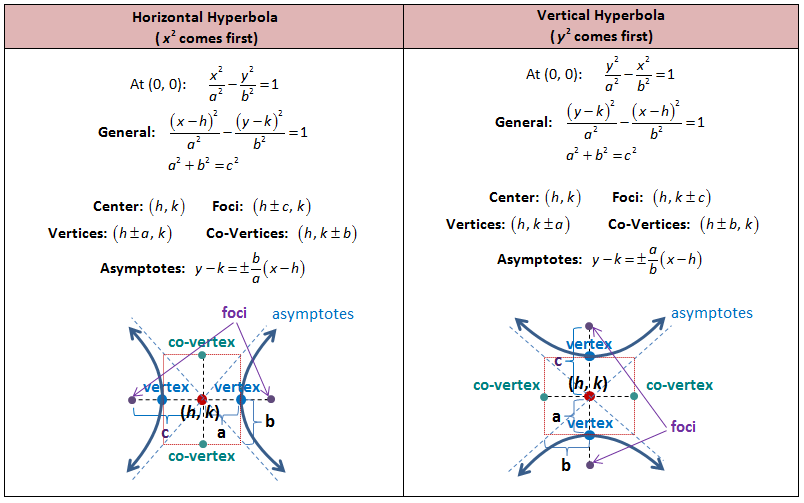
- Pinched ovals versus circles, which is better?
- Modeled as fitting to some hyperbolas, with some degree of fit.
- Pore Size
- SERS properties should increase exponentially the closer the gold gets to itself. Yet 1085 has larger pores than the 1147 material.
- How does this relate to the conicity?
- How does the gold infiltrate these structures? I suspect a shallower cone allows the gold to get closer together.
- SERS properties should increase exponentially the closer the gold gets to itself. Yet 1085 has larger pores than the 1147 material.
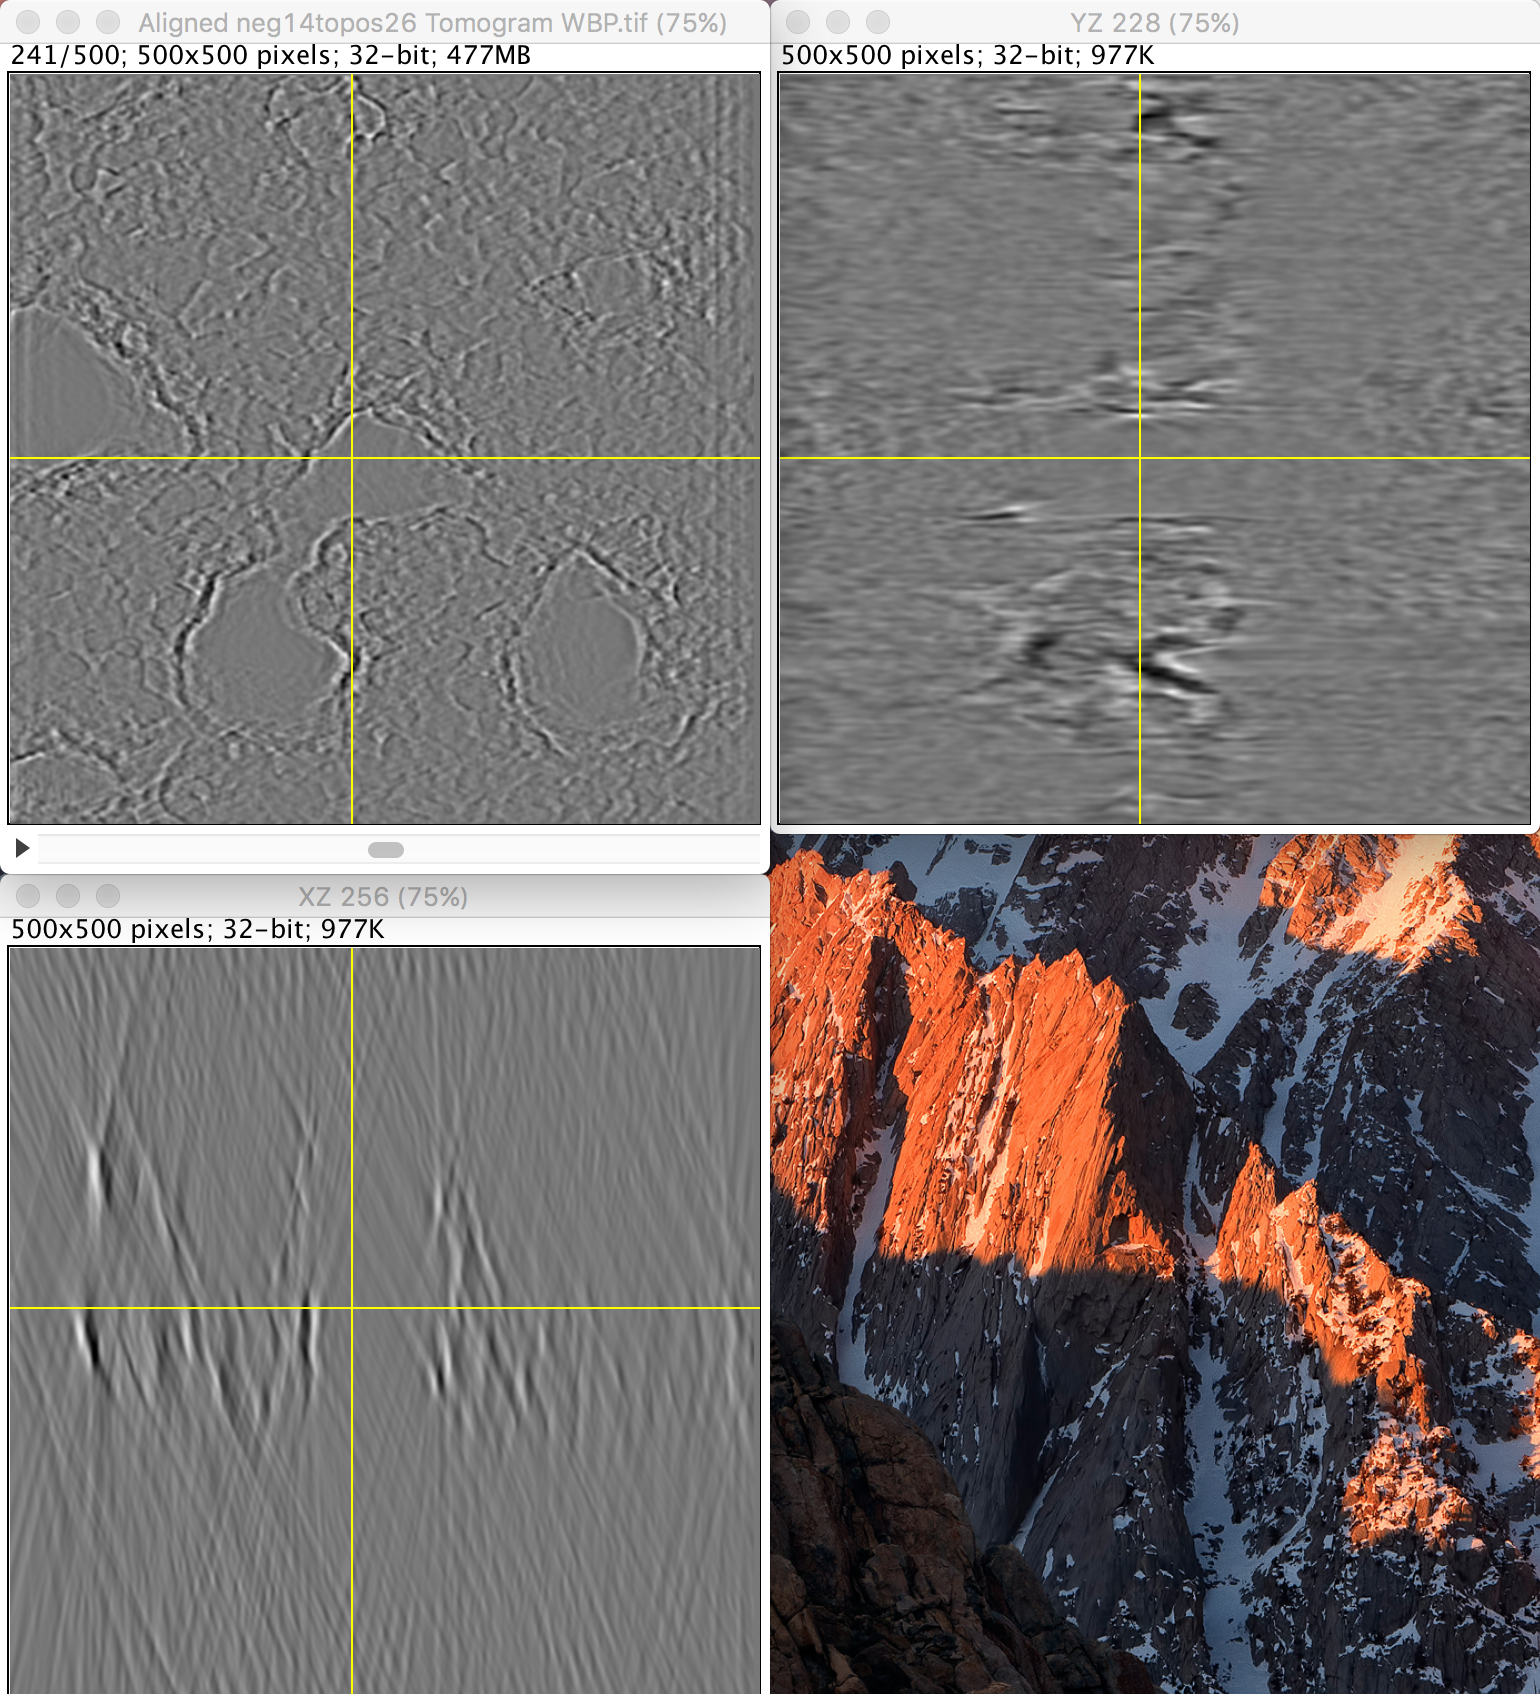
To address these questions, we can begin with reslicing our tomograms. The tomograms I have generated have been made of slices through the Z-axis. Orthogonal views are illuminating (equivalent to crossectioning the membrane).


Work to do
- Automate process of curve extraction and equation generation.
- Everything done by hand here should be automatically extracted
- This work is one section; how do we tackle multiple curves in different projection planes?
- Add in measurements of Surface roughness (deviations from goodness of fit?)
- Goodness-of-fit curves