Top SiO2 Thickness Experiment (3)
Last few weeks, I deposited a couples of wafers to test the effect of oxide thickness on pores. In addition to previous data, I deposited another two wafers, one with 1nm top oxide and the other with 100nm top oxide. I summed up all data from the top oxide experiments. The first image is the TEM images of eight samples with different top oxide thickness.
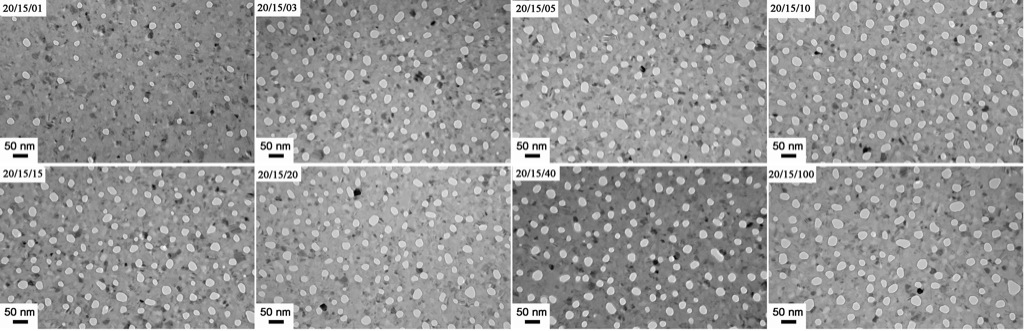
From this image, it is clear seen that pore size and density dropped greatly when top oxide thickness decreases to 1nm. However, the pore size and density did not change much even the top oxide went to 100nm thick. The followings are detailed data by using the pore process program in Matlab software.

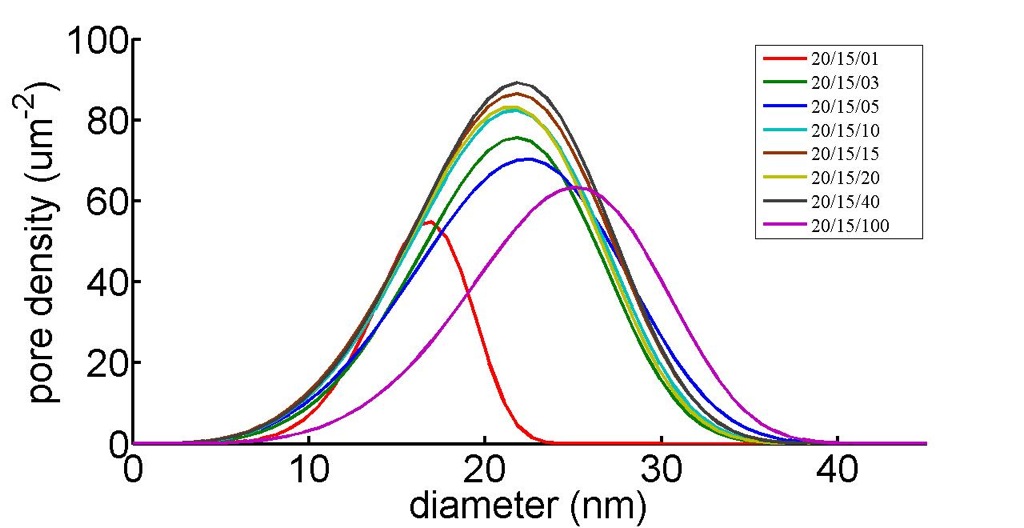
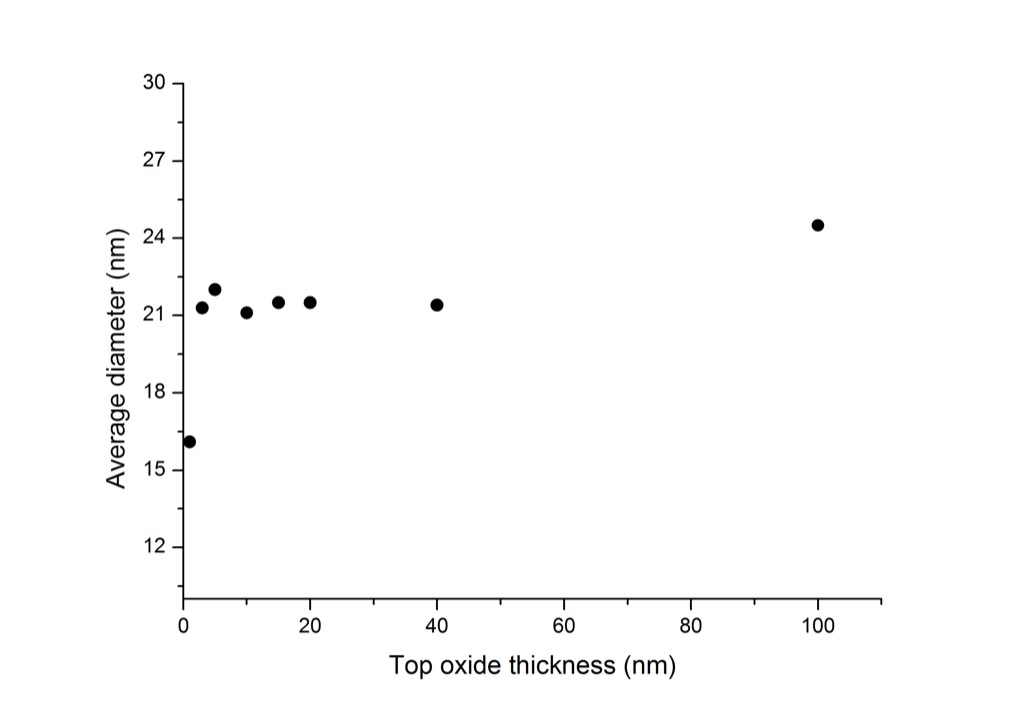

In the porosity plot, it can be clear seen that porosity did decrease quite a bit as we expected when top oxide decreased from 3nm to 1nm. However, 100nm top oxide still showed high porosity. Compared the pore density plot with pore diameter plot, it can be seen that the pore density and diameter distributions were on a ‘ramp up’ stage when the top oxide thickness increased from 1nm to 5nm. After that, they reached to a stable stage where the top oxide thickness would not much affect the pore size and pore density, even the porosity. When the top oxide increased to 100nm, the porosity did not change much, however, it’s not true for the pore size and pore density. The average pore size increased about 2nm and pore density decreased a little bit which did also make sense as the porosity was keeping high.
One question still in my mind is that whether the porosity and pore size would finally drop when keeping increasing the thickness of top oxide. Does the ‘ramp down’ stage exist? Is it necessary to do an even thicker top oxide experiment? Because100nm looks pretty thick compared to the thickness of a-Si layer and bottom oxide.
nice results. two questions. 1) how do you know the exact oxide thickness? and 2) if there is no oxide, you should get agglomeration, which means that the surface roughness will then be very large (peak to peak distances could be 10’s of nm or more- so for the thinnest oxide, do you see an increase in roughness, for example observed via AFM?
For oxide thickness, we recalibrate the deposition rate everything after the regular maintenance. The deposition rate of SiO2 we got last time was y=0.0204x-0.3636, where y is the thickness(nm) and x is the time(s). So 66s gave me 1nm thick oxide according to the dep rate. It maybe not very accurate since the deposition rate was not liner at beginning. However, compared with the deposition time, 66s is the shortest dep time so far I’ve done.
As to the roughness, I haven’t done any AFM on this sample yet, but I think the roughness of the thinnest top oxide sample might be larger than thick top oxide sample. I’ll have a try.