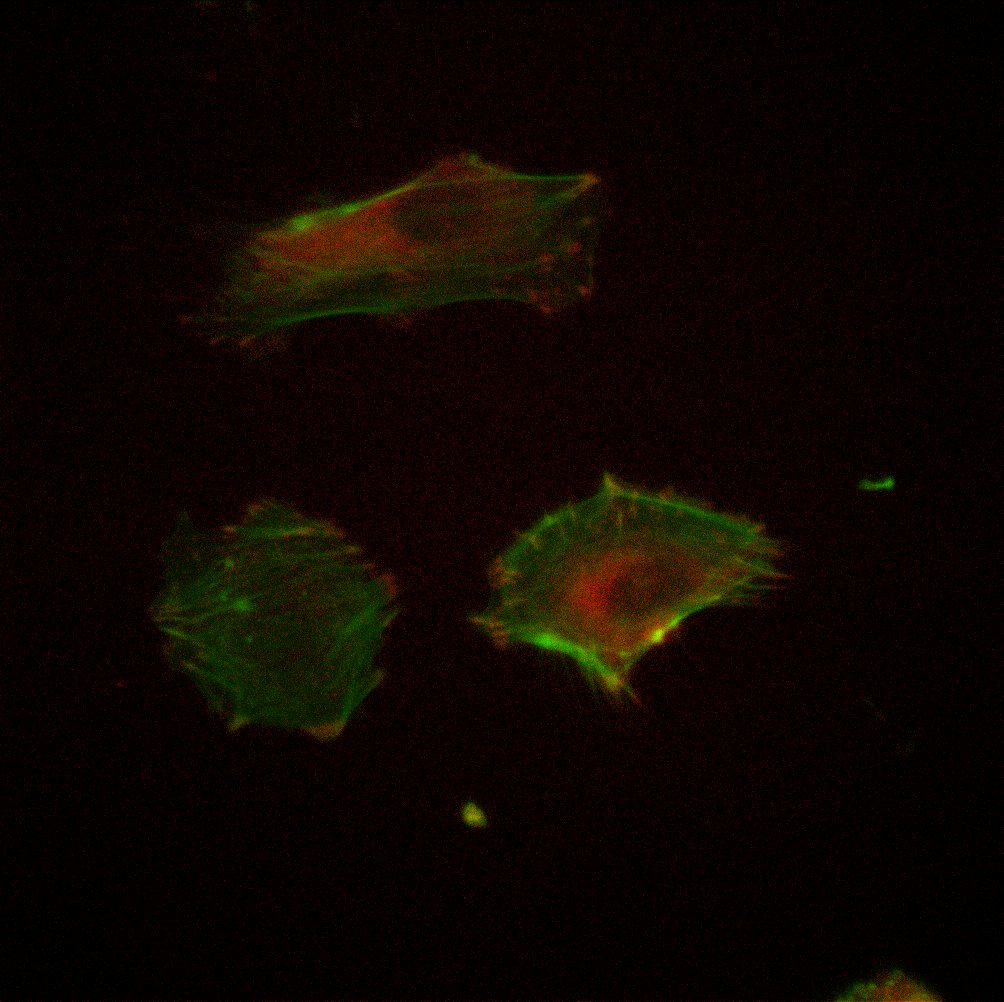
Purpose: To investigate the formation of focal adhesions (FAs) on various cell culture substrates, including TCP, SiO2 membranes, and PDMS membranes.
Background: FAs are large macromolecular assemblies through which mechanical force and regulatory signals are transmitted between the extracellular matrix (ECM) and an interacting cell. FAs consist of a complex network of ECM, membranes, and cytoplasmic components at which endothelial cells (ECs) adhere to ECM proteins or the cell culture substrate. One cytoplasmic component of FAs is vinculin, a structural molecule that is concentrated on the cytoplasmic side of the FA and aids in attachment of actin filaments to the plasma membrane. Stiff, non-compliant 2D cell culture substrates promote the formation of distinct stress fibers and, subsequently, FAs. Cells fully embedded inside 3D matrices do not readily form FAs.
Methods:
Substrates included TCP with or without a 1% Geltrex coating, in duplicate. A retention gasket was used for ease analysis. Three identical plates were created for analysis at 3 timepoints, 4 hours, 24 hours, and 72 hours. HUVEC were grown to confluence, passaged, and seeded at a density of 5000 cells/cm^2.
Plates were stained with Phalloidin and Vinculin Ab and then imaged at their respective timepoints.
Staining Protocol:
1. Wash with PBS (1x)
2. Fix with 3.7% Formaldehyde in PBS (RT, 15 min)
3. Wash with PBS (1x)
4. Permeabilize with 0.1% TX-100 in PBS (RT, 3 min)
5. Wash with PBS (2x)
6. Block with 1% BSA in PBS (RT, 15 min)
7. Wash with PBS (2x)
8. Stain with 1uL phalloidin in 200uL PBS (RT, 15 min)
9. Wash with PBS (2x)
10. Stain with 1uL Vinculin Ab in 100uL PBS (Varying incubation time)
11. Wash with PBS (3x, leave last wash in)
Vinculin Incubation:
Plate V2: RT, 1 hour
Plate V3 & V4: 4C, 2 hour, well flooded with 300uL PBS after 1 hour to curb evaporation.
Imaging:
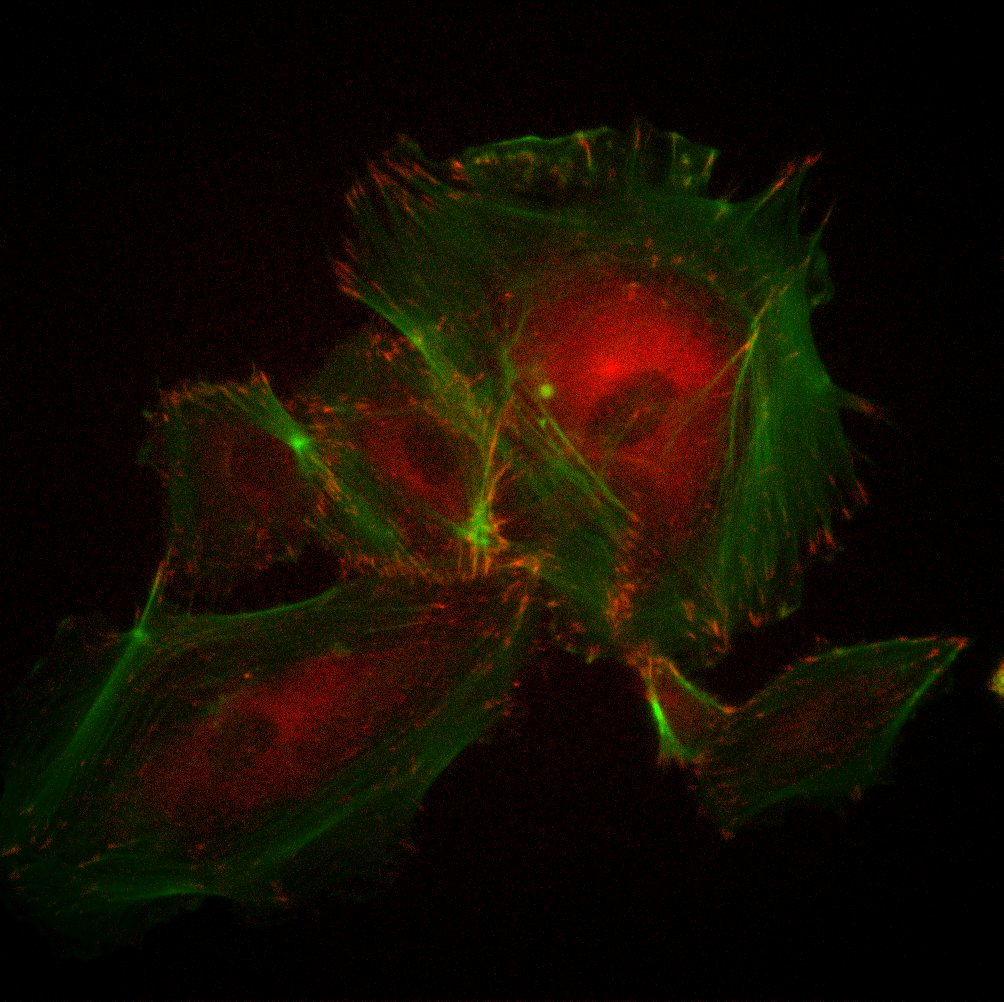
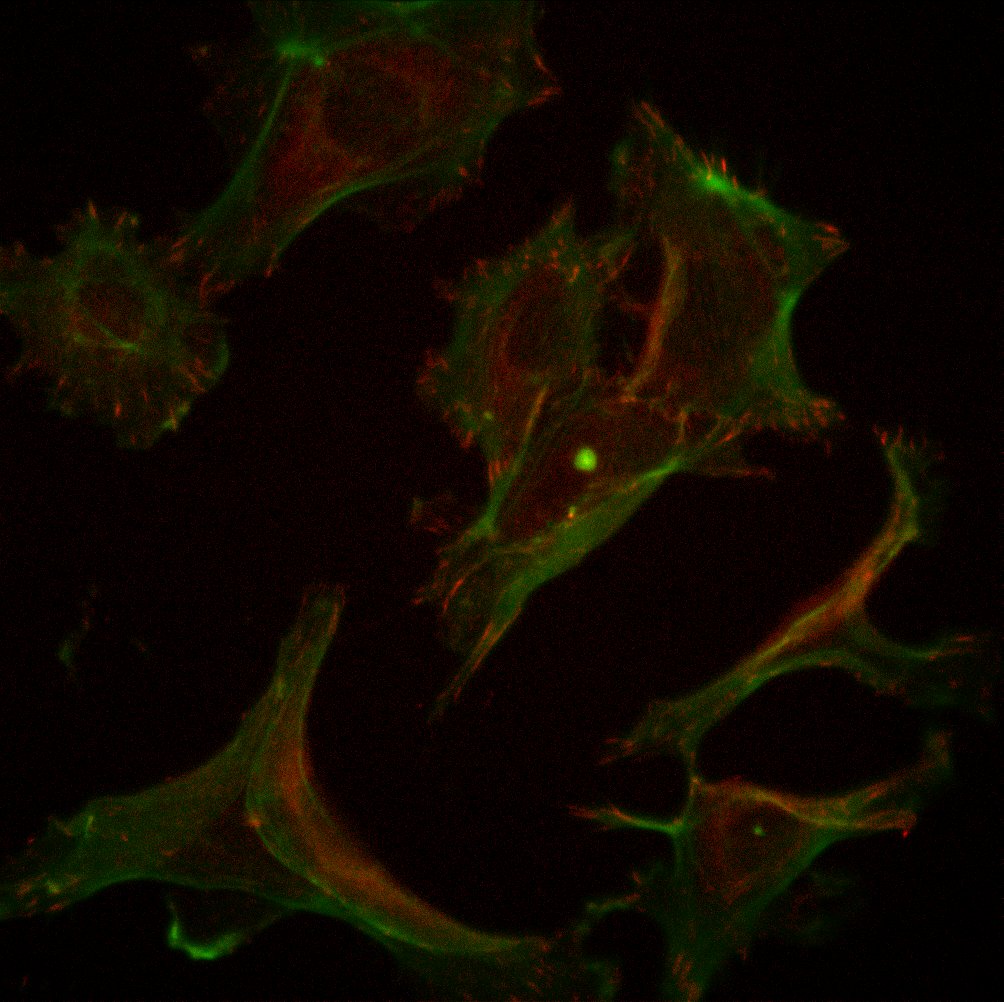
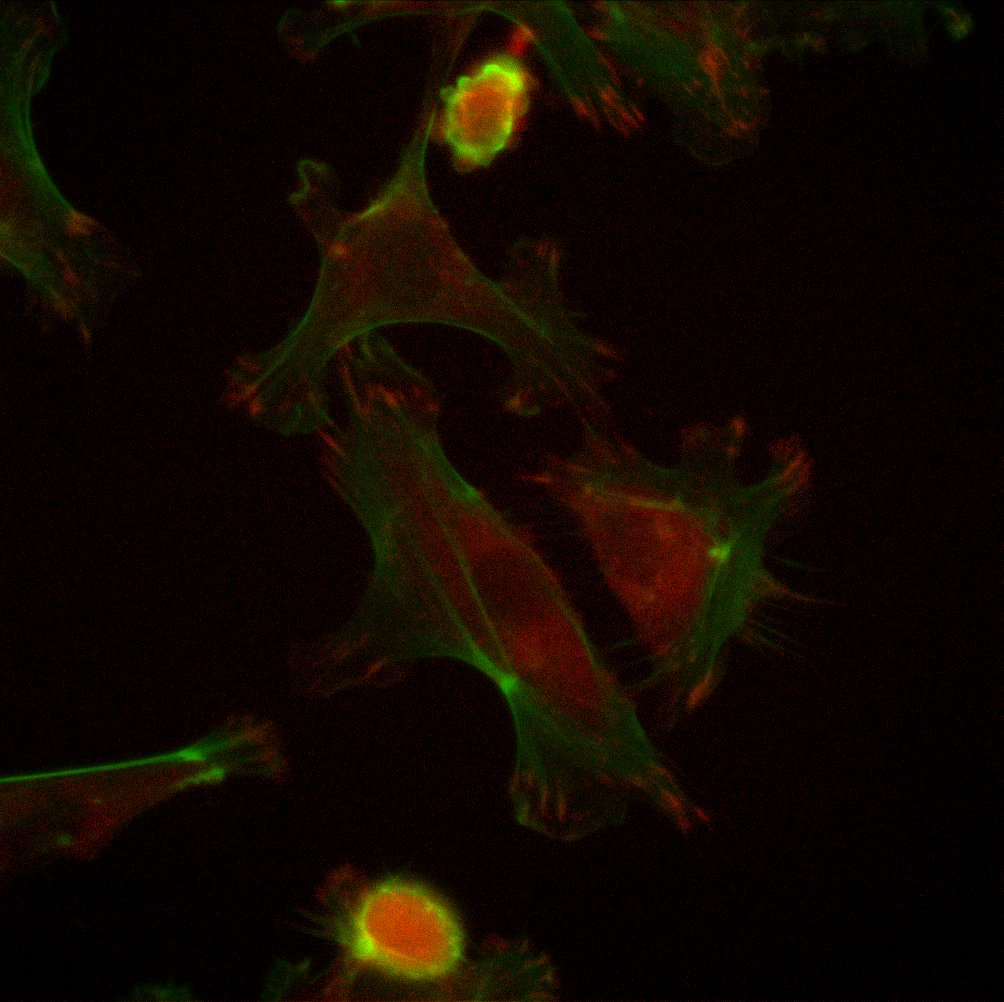
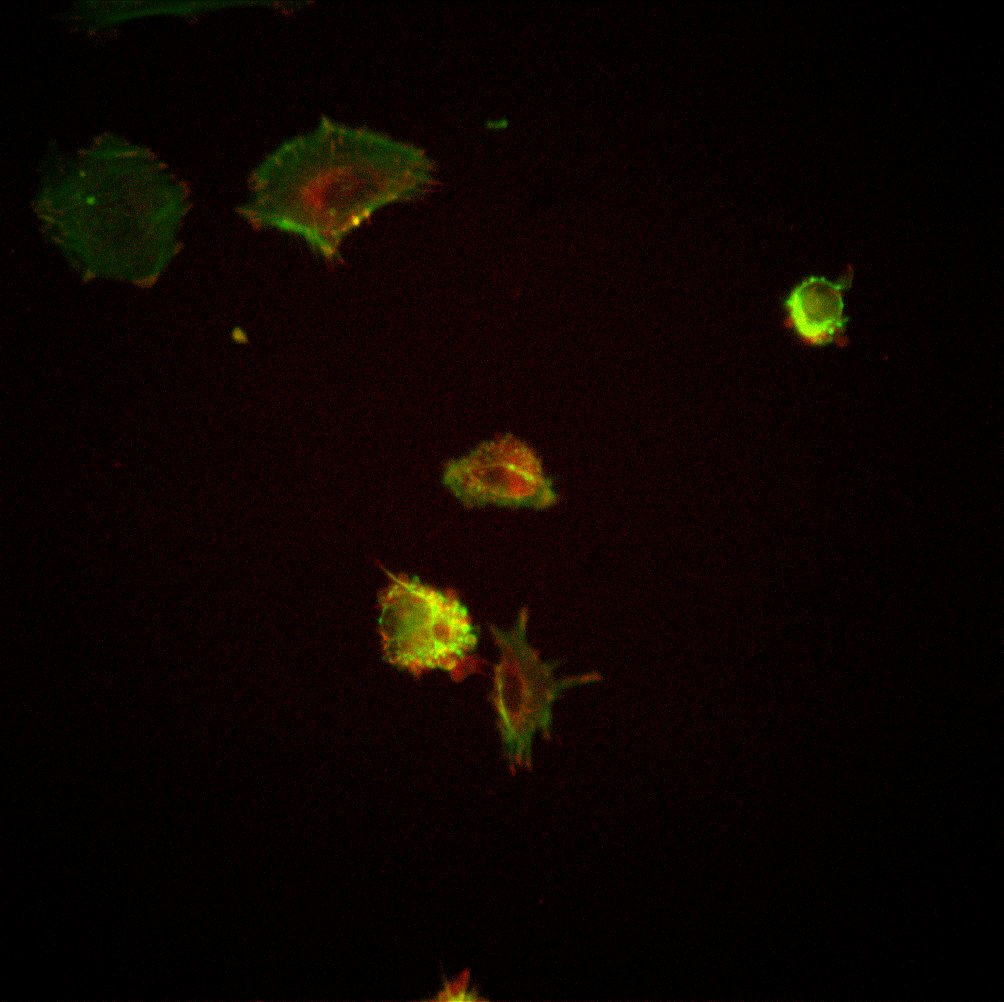
Wells imaged using the fluorescent channels GFP (300ms) and TxRed (500ms), as well as phase contrast (20ms). Images captured using 10x, 20x, 40x, 63x. Vinculin staining captured most distinctly using the 40x and 63x objectives, as shown below.
Results:
Plate V2, 4 hours:
TCP with Geltrex, 40xTCP with Geltrex, 63xTCP without Geltrex, 40xTCP without Geltrex, 63x
Plate V3, 24 hours:
TCP with Geltrex, 40x
TCP without Geltrex, 40xTCP without Geltrex, 63x
Plate V4, 72 hours:
TCP with Geltrex, 40xTCP with Geltrex, 63xTCP without Geltrex, 40xTCP without Geltrex, 63x
Conclusions: HUVEC seemed to be less dense and less spread on a majority of the TCP without geltrex, with respect to the HUVEC cultured on TCP with geltrex. Cells that are less spread have less distinct actin stress fibers and subsequently less FAs marked by vinculin. For spread cells on both substrate conditions, vinculin can be observed in both the perinuclear region and at the termination points of actin stress fibers. We do not yet have a quantitative method for measuring the prevalence of FAs. Yet, from qualitative observation, I would conclude that presence of FAs is dependent on the ability of cells to adhere to and spread on a substrate. For the TCP with geltrex, the substrate was coated with a layer of basement membrane proteins. These proteins assist the HUVEC in attaching to the surface, and may have led to the cells increasing their spread area and developing distinct actin stress fibers. For the TCP without geltrex, even though the HUVEC were cultured on a flat substrate that is optimized for cell culture, the substrate was void of basement membrane proteins, making adhesion and spreading more difficult for the cells.
Future Experiments: Currently in the process of repeating this experiment on SiO2 and PDMS membranes. As previously explained, literature states that cells grown in 3D environments should not form FAs. We often compare our SiO2 membranes to 3D cultures because cells are exposed to media on both sides of the membrane. However, previous experiments have shown that cells do form distinct actin stress fibers on the SiO2 membranes. Therefore, I hypothesize that the HUVEC will form FAs on the SiO2 membranes.
This is a follow up to Josh’s post, “Continued Au Separations with SiN-NP wafer #’s 1029 and 1030”, and seems to explain why we initially got an S value greater than one during our gold separations. We conducted tests to see if the colored centrifuge tubes were at fault for our seemingly large filtrate absorbance…
Two weeks ago (as of the time of writing this post), I wrote a post on a dead end filtration experiment that I ran in order to demonstrate particle capture in pores, modeling a simple, purified exosome capture system that we could use for imaging or analysis. However, when I ran that experiment, I done…
Yesterday I posted the results from an experiment testing diffusion of BSA and DDM with salts (10mM) across “treated” and “untreated” SC256 samples. The results posted yesterday showed relatively equal amounts of DDM diffusion in both the “treated” and “untreated” case. For the BSA diffusion however the results showed that a greater amount of BSA…
All separations are 30 nm (diameter) gold nanoparticles in a 56 nm pore setup, with other parameters as described in my last post. Y-axis scale bar is in meters, x-axis scale is meaningless (the simulation is 1-D, and the width is added just for clarity’s sake). The membrane is at y = 0. Color corresponds…
The initial purpose of exploring formlabs SLA 3D printer for a collaboration with Dr. Nicola Marchi (link to previous post). The purpose of the this work was gaining the ability to use a simple membrane on 3D printed platform for BBB modeling and WBC migration though endothelial (and glial cell layers) and collecting and…