Update: automation analysis of cell migration and fibronectin fibril characteristics
Hi all,
Recently we finished drafting the manuscript titled “Porous substrates promote early endothelial migration at the expense of fibronectin fibrillogenesis.”
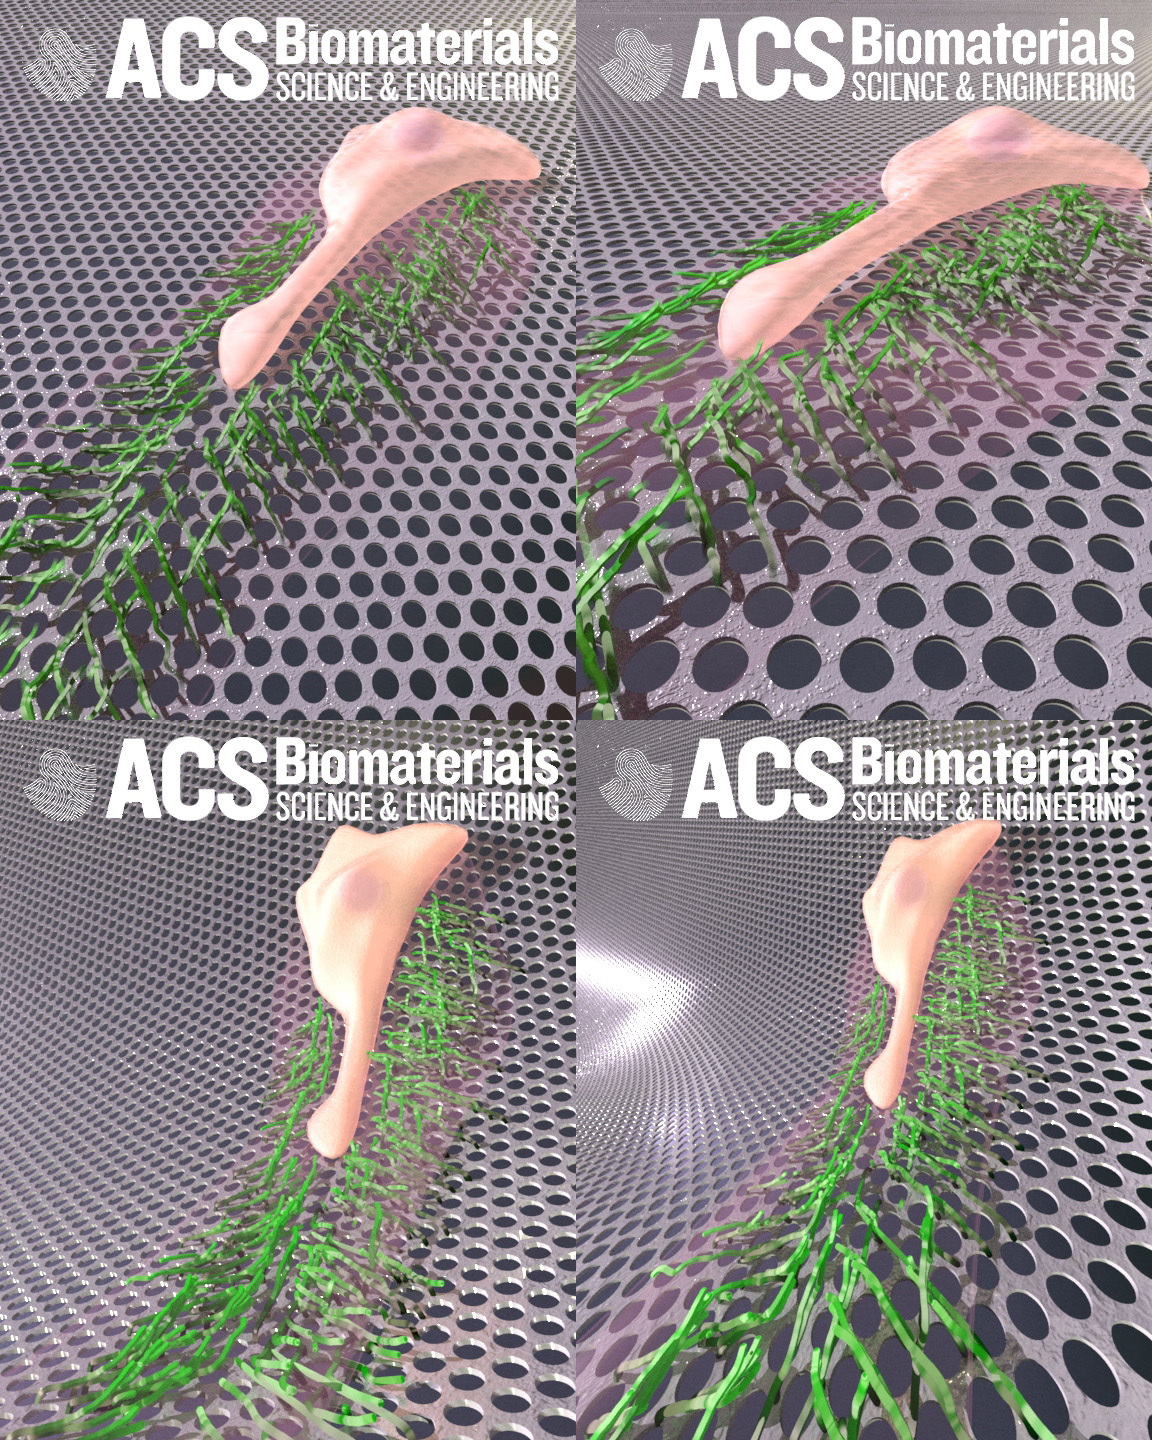
This manuscript will feature the cover illustrated by Brad (our new medical illustrator in the Gaborski Lab):
Long story short (another illustration by Brad):
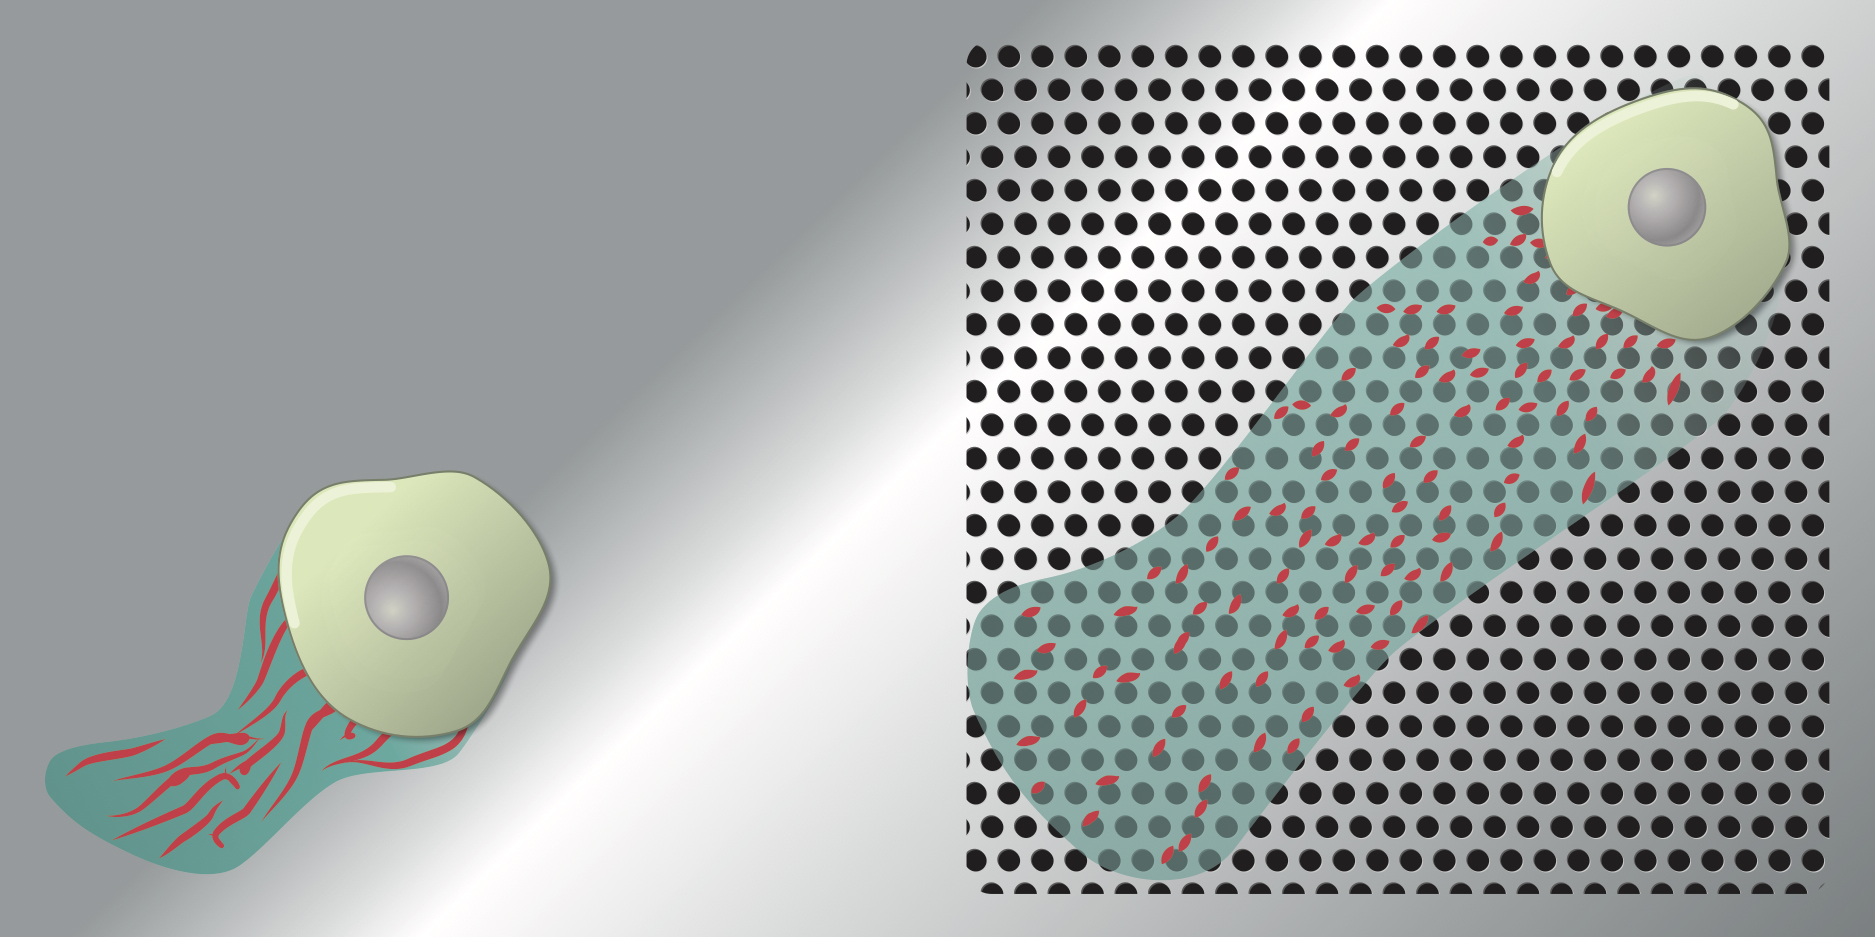
- Left (nonporous control substrate): cell traveled slower, covered smaller area, but laid down longer fibronectin (FN) fibrils.
- Right (porous substrate): cell traveled faster, covering more area over time, but laid down smaller FN fibrils.
- Therefore in theory, porous substrates would promote faster wound recovery, but as toll, the underlying ECM may be weaker initially.
Critical to the manuscript (and the next bigger, better, and faster one with fibroblasts) is the automated measure of FN fibril length from fluorescent images.
Example of the analyzed FN fibrils:
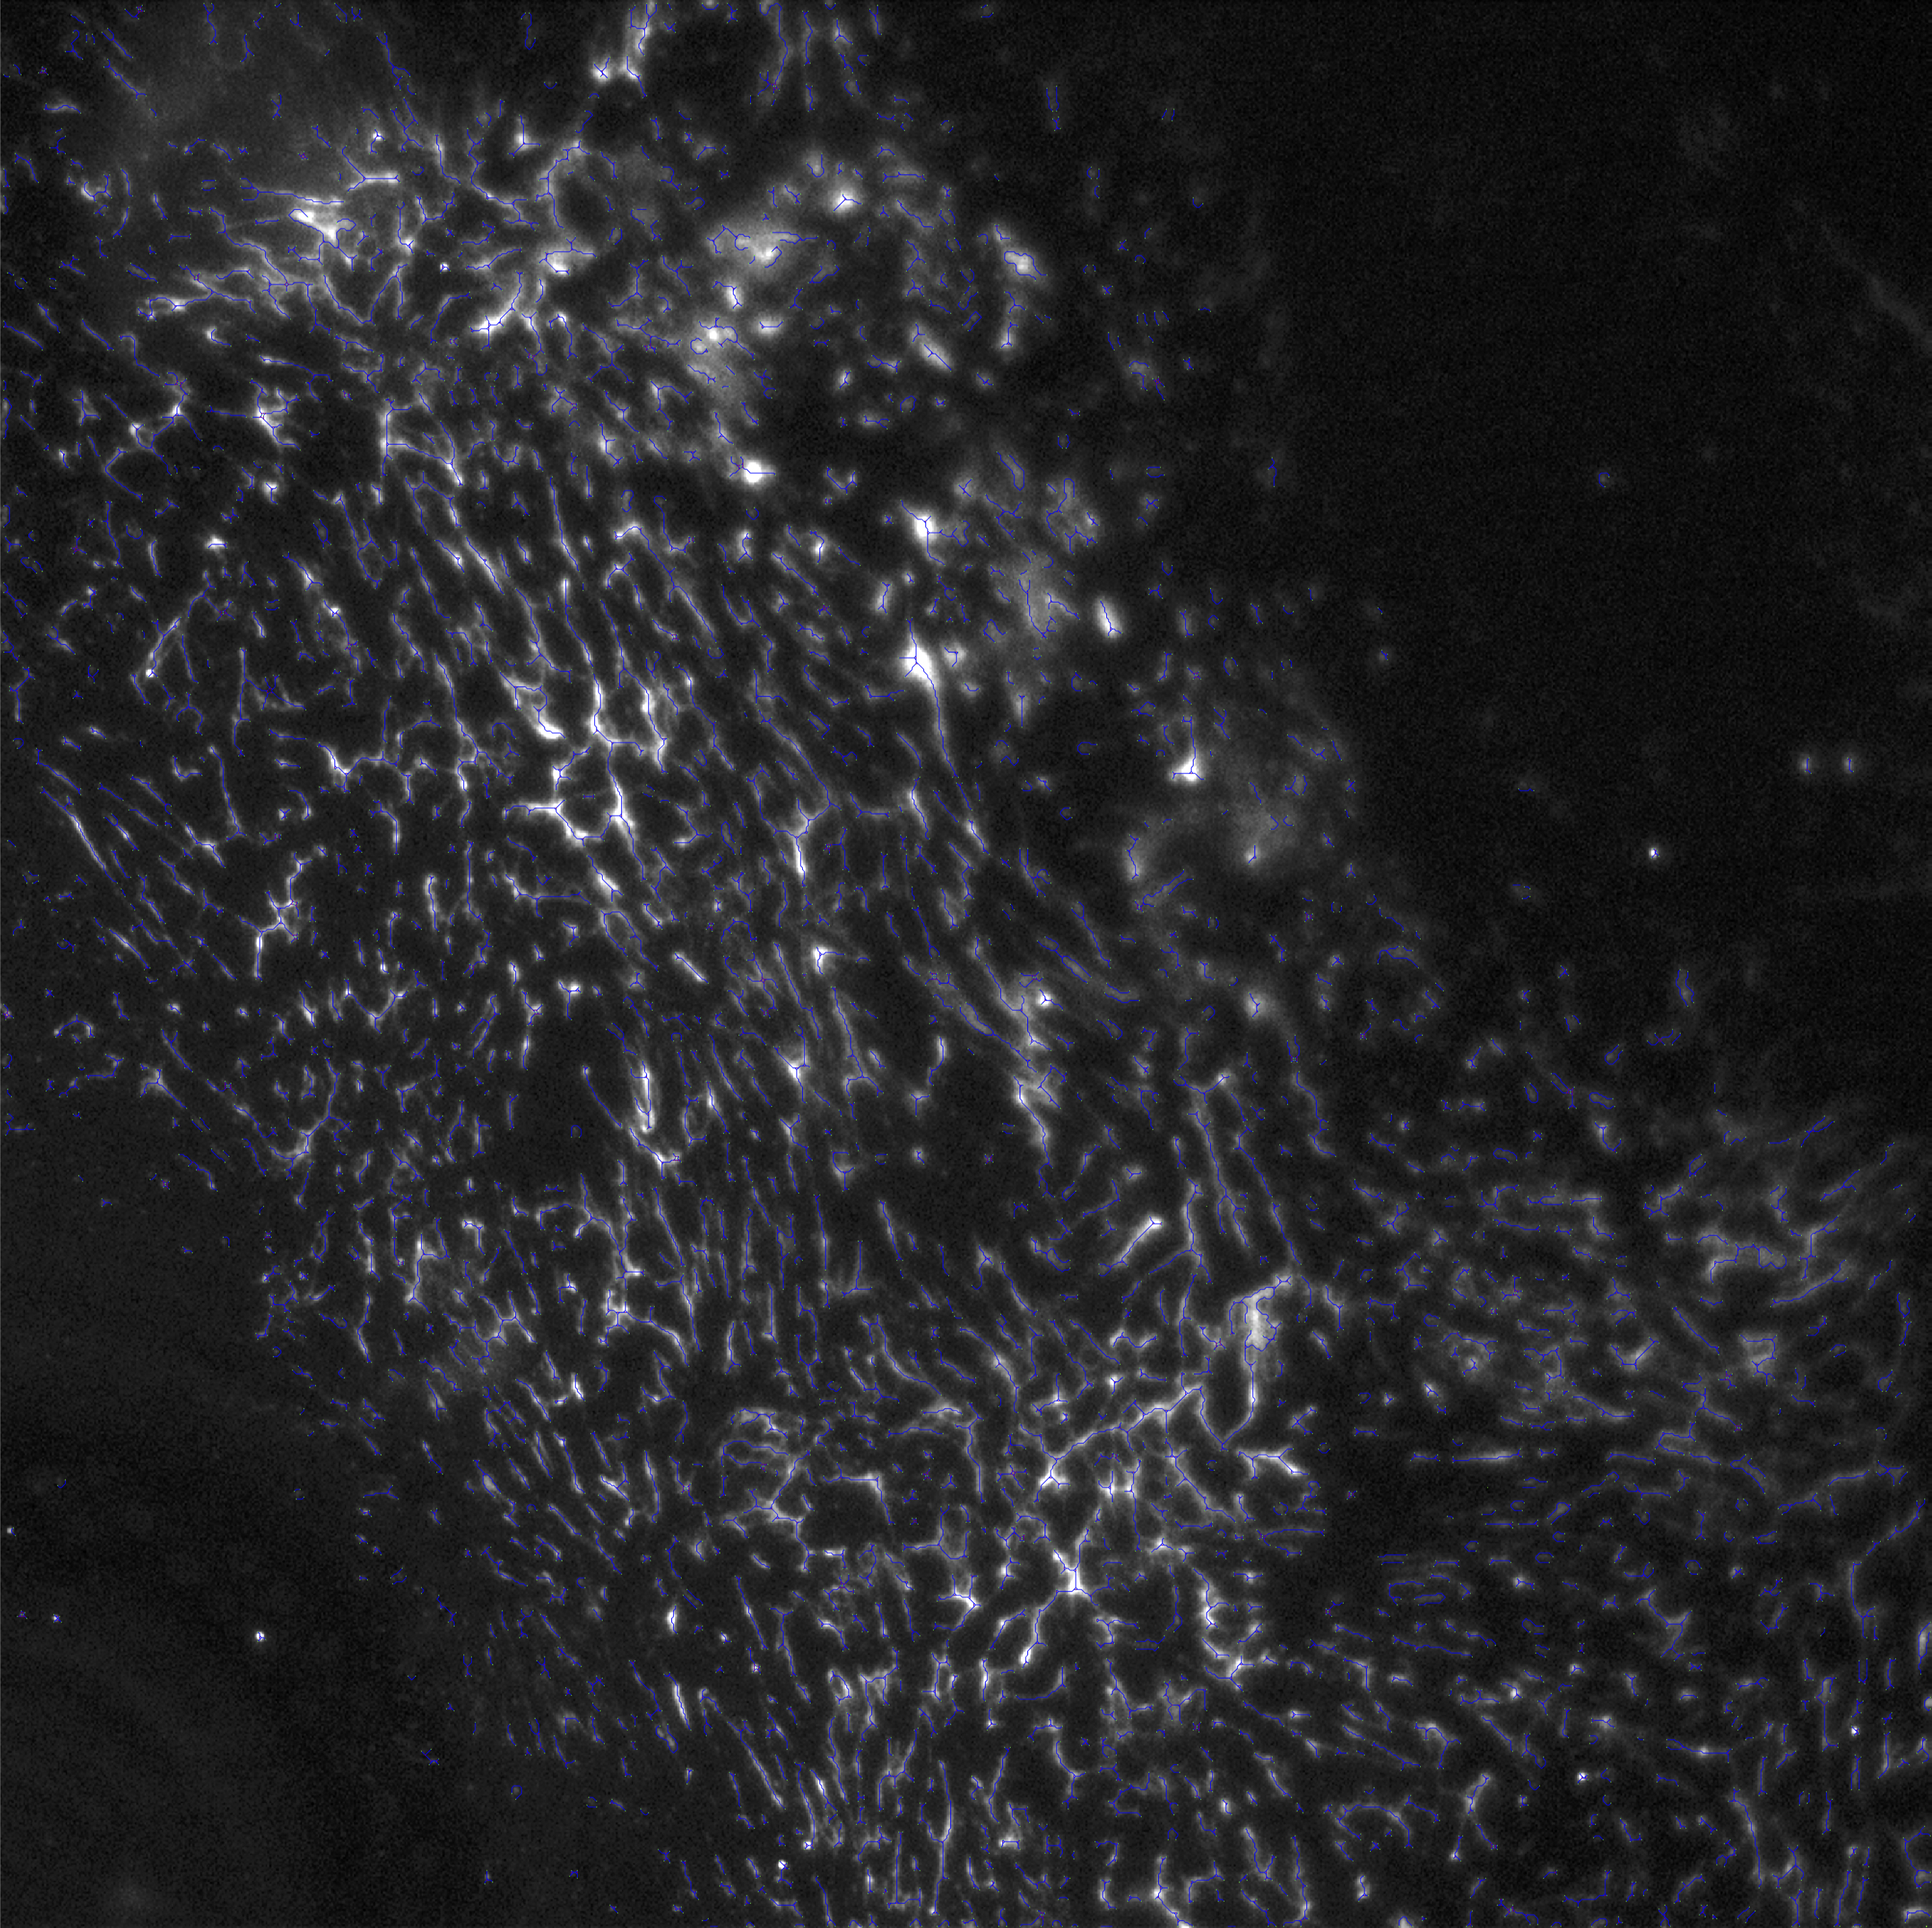
The fibril skeleton (in blue) is overlaid onto the original image. The branch points are annotated in red, and the end points are annotated in green.
Old version of fibril analysis:
- Identify the fibril using edge detection.
- Approximate the fibril length by dividing the perimeter of the identified fibril by half.
New version of fibril analysis:
- Use background correction to enhance the signal to noise ratio of the edge.
- Identify the fibril using edge detection.
- Shrink the identified fibril to its skeleton only.
- All branch points and end points of the skeleton are identified. The connection between each end points and its associated branch point defined each branch.
- The segment of the skeleton that is not a branch is define as the trunk. The longest running segment is defined as the backbone. The fibril length is reported base on the length of the backbone. The backbone could be the trunk itself, the longest branch, or the combination of a trunk and one or two of longest branches.
General comment:
- Base on subjective, visual assessment, the background correction helped identify the FN fibril better.
- The approximation of the fibril length base on the half perimeter actually did a pretty good job.
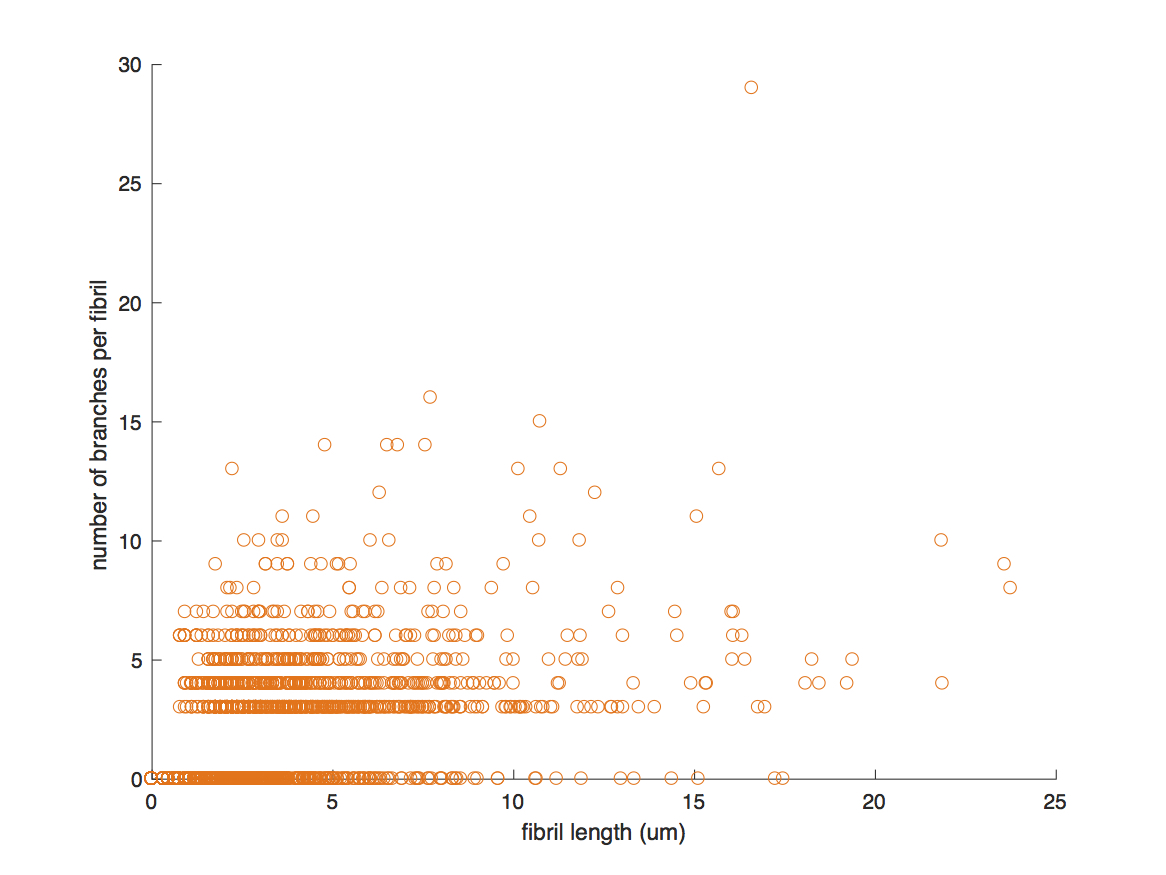
- The characterization of branching may be a big plus for future works.
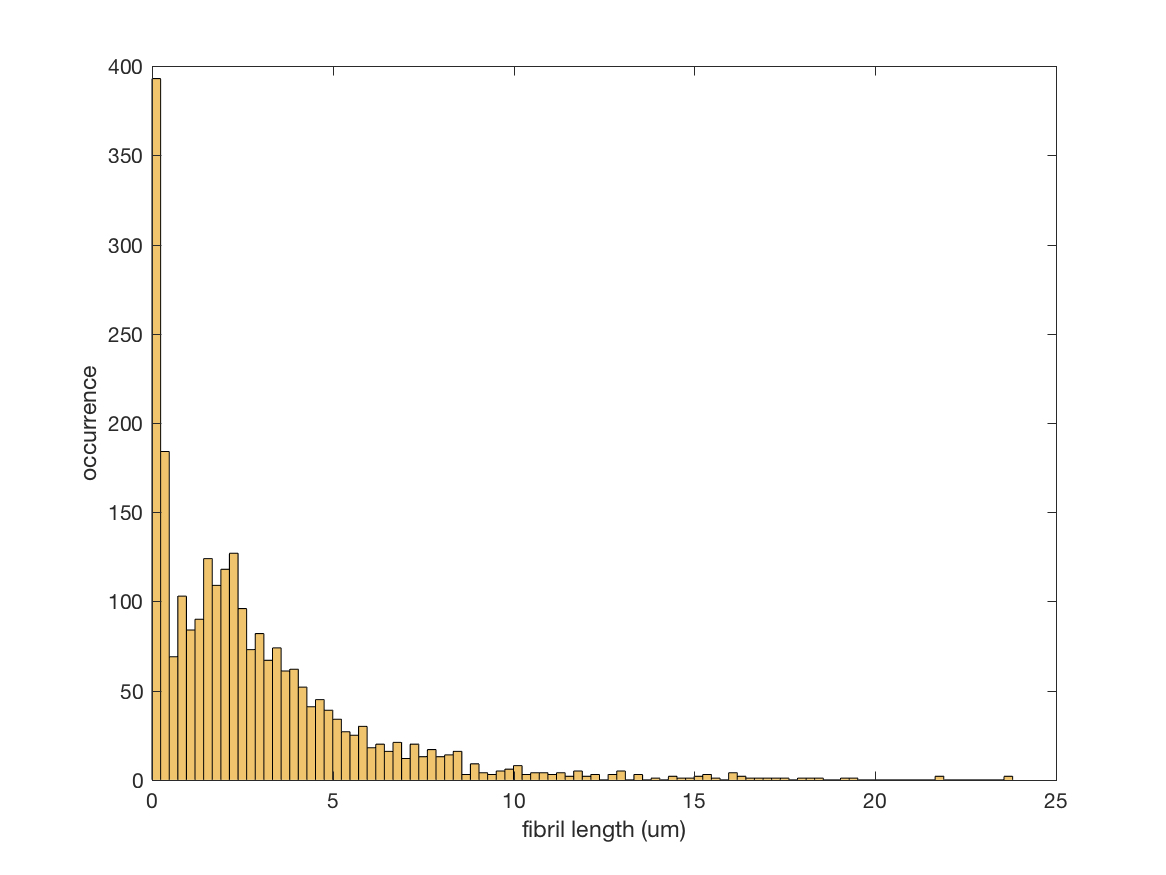
Some output data example:
We are also improving the analysis of cell migration.
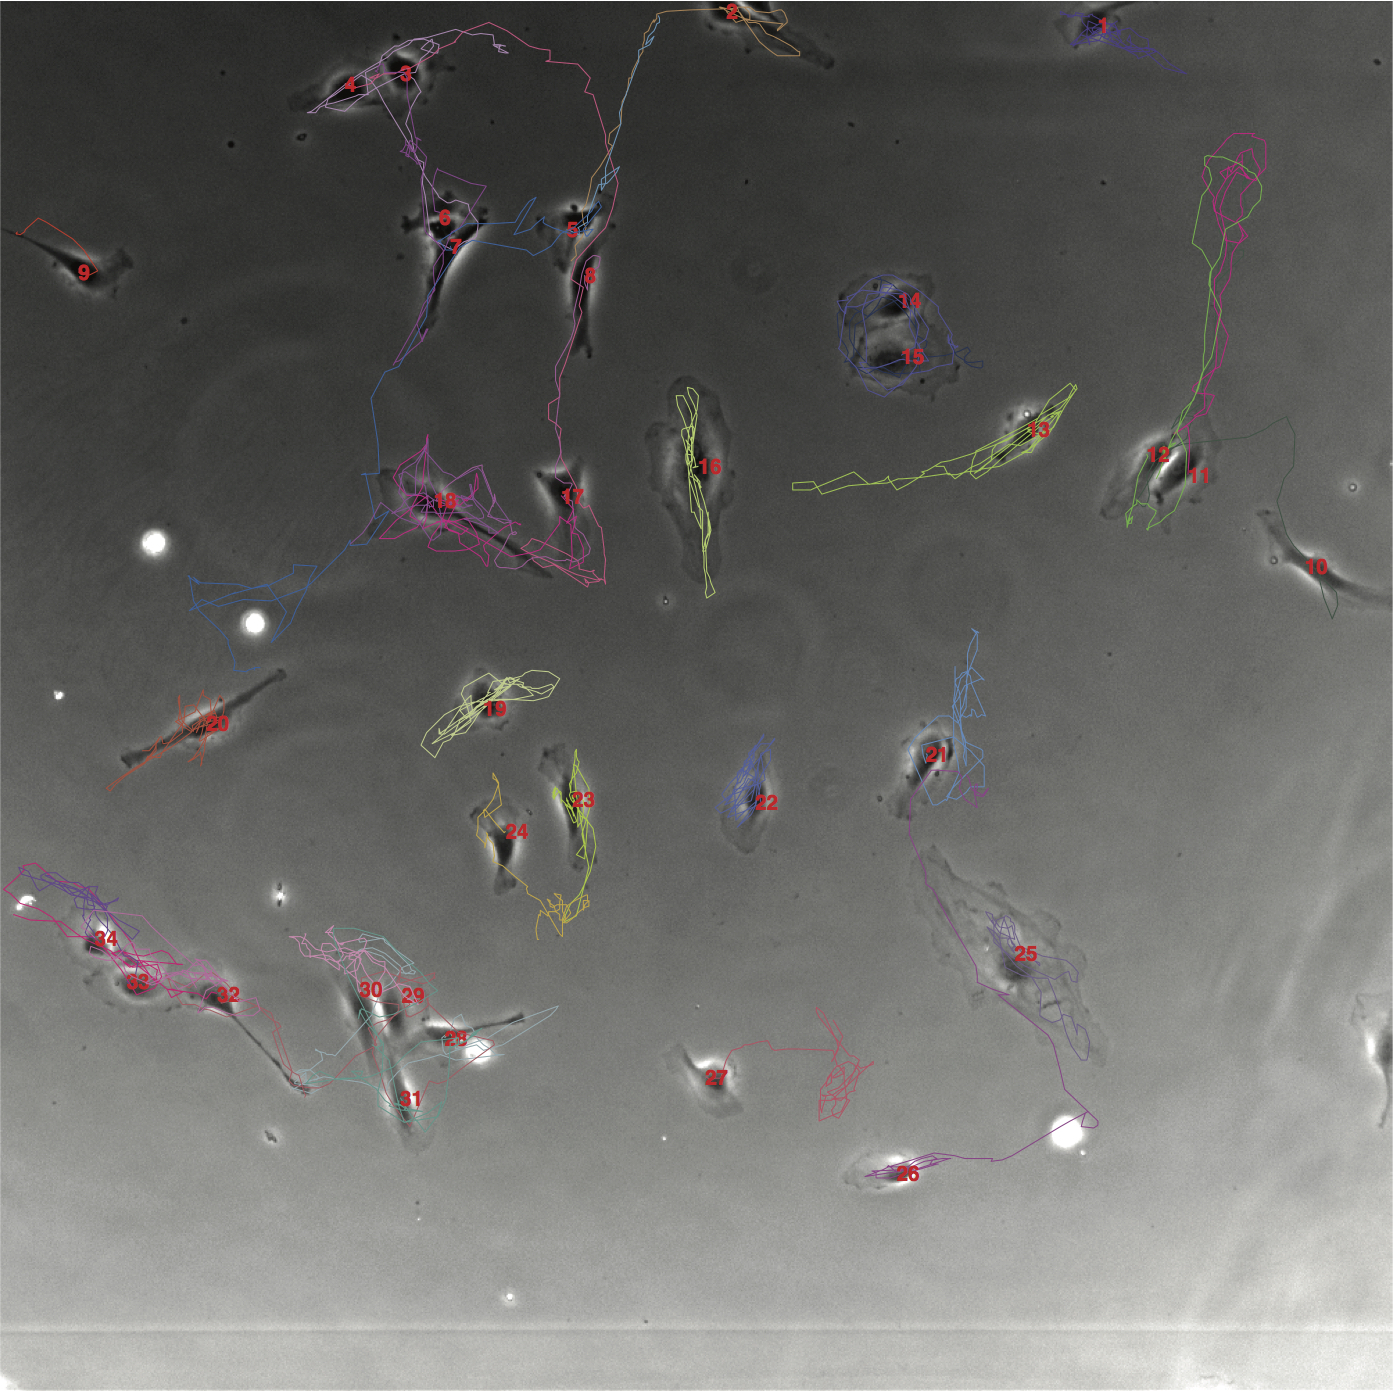
Example of cell migration analysis:
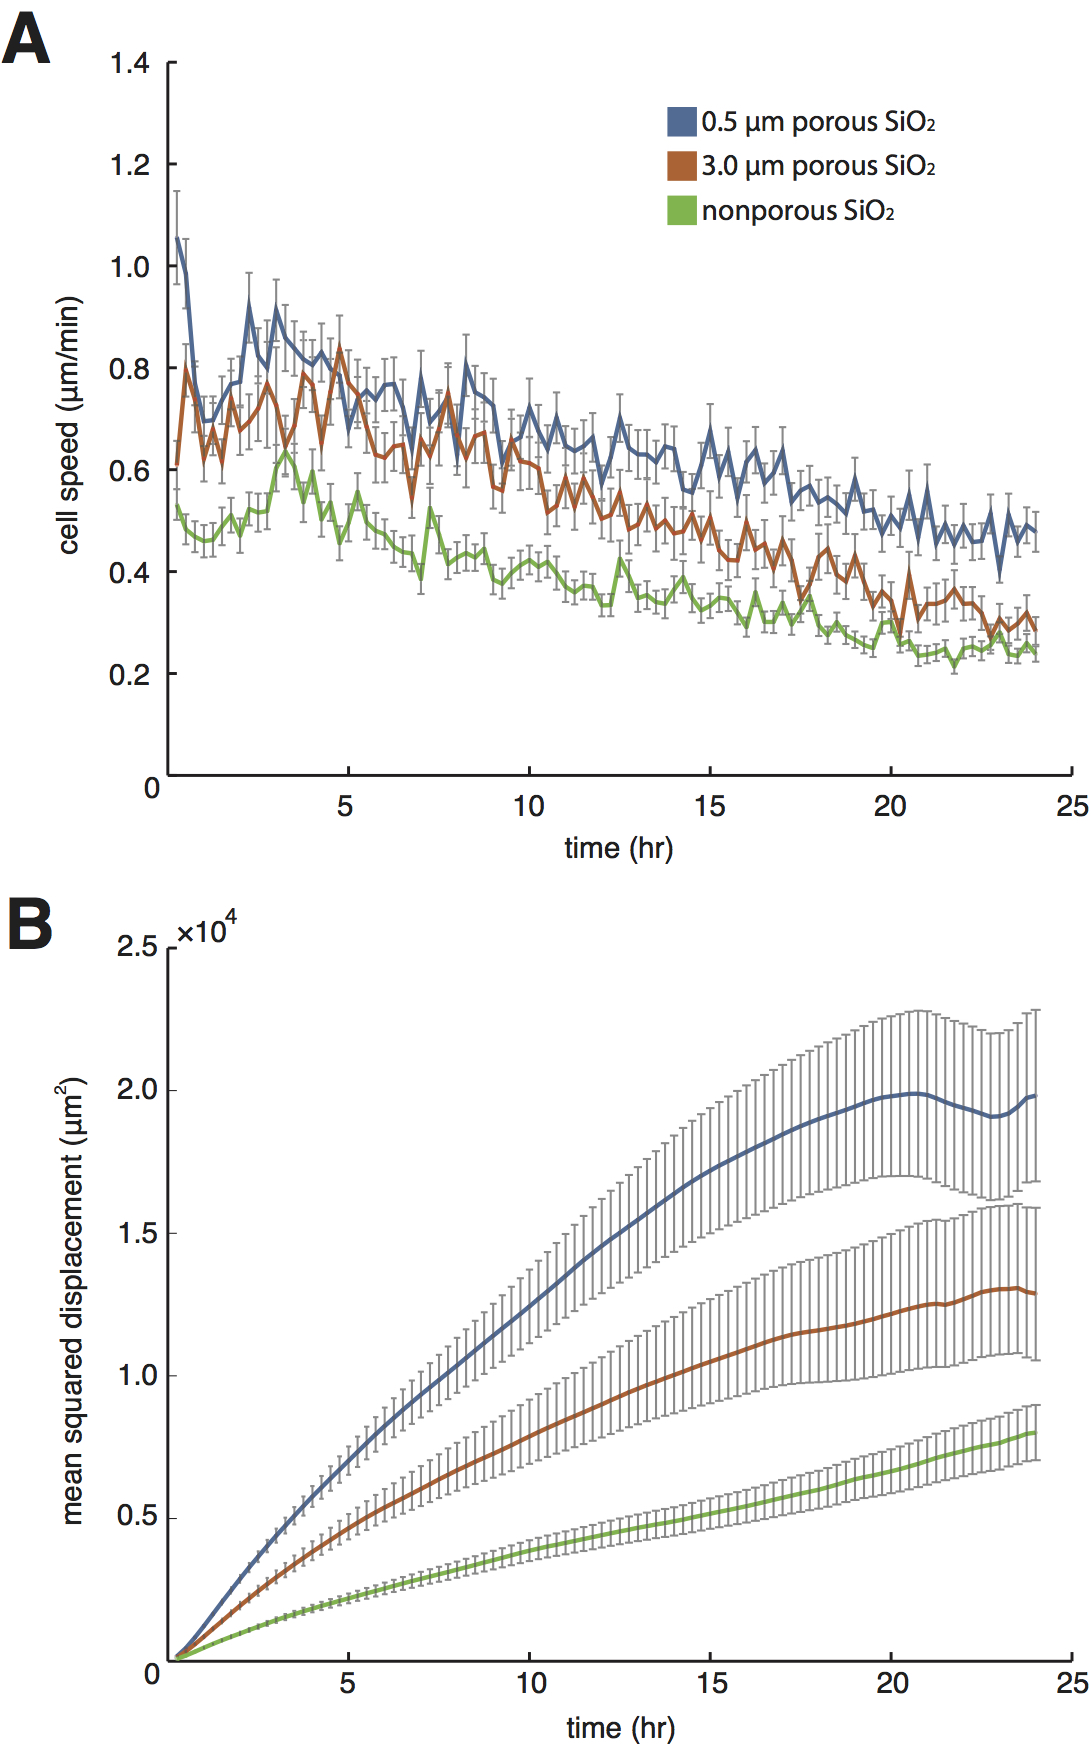
More specifically, we are also reporting the time progression of migratory metrics.
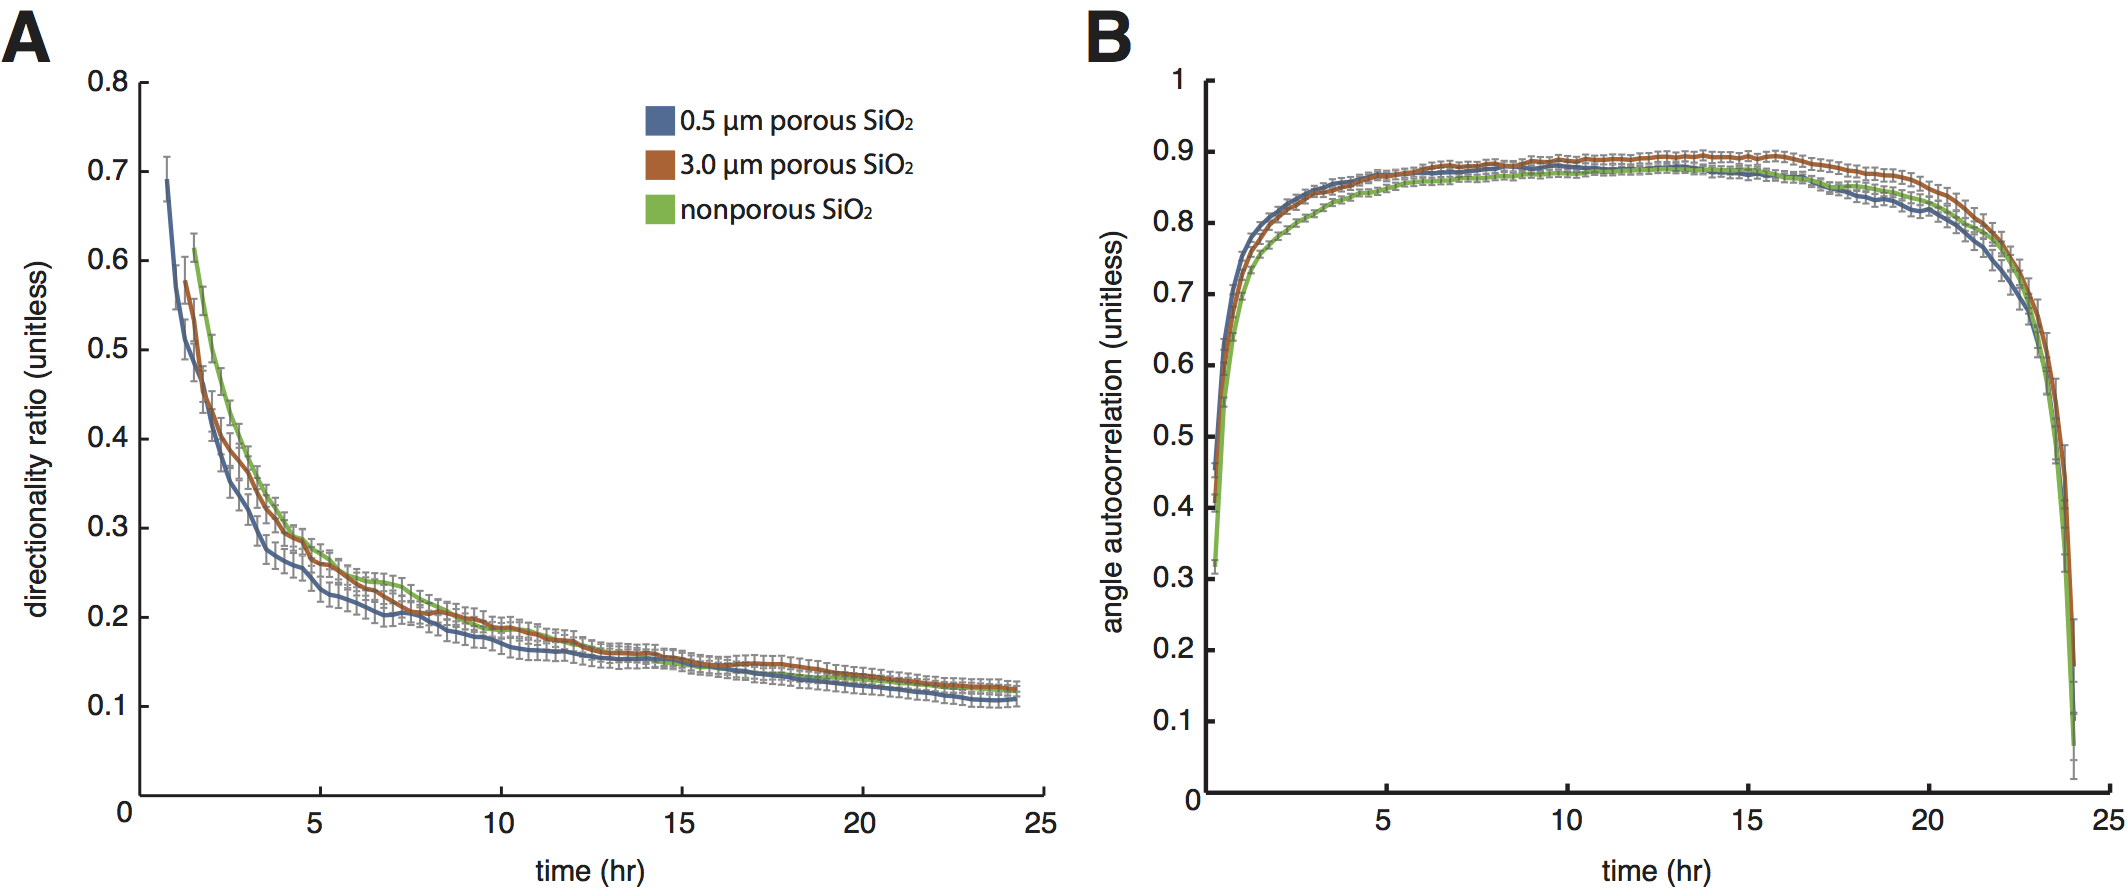
One highlight is the newly included analysis of migratory directionality based on angle autocorrelation:
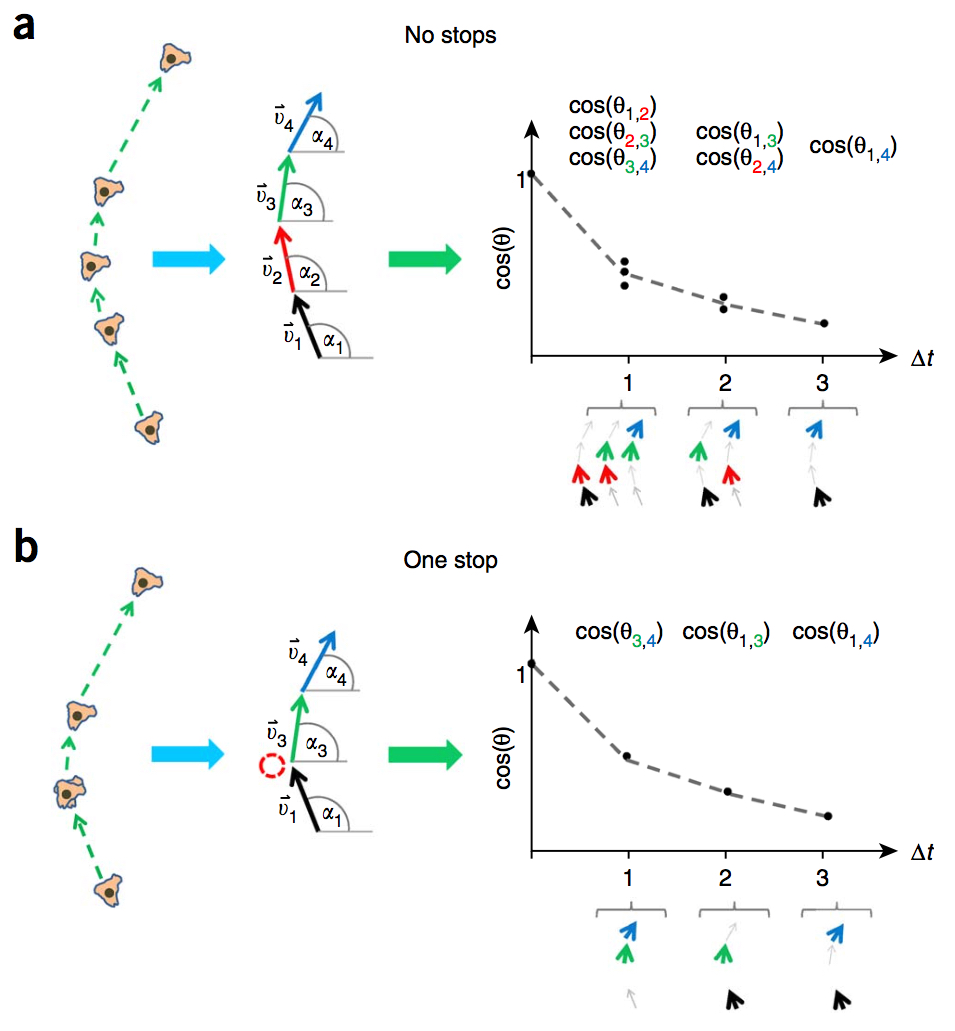
image from the paper by Gorelik anbd Gautreau

- N = the total number of displacements per trajectory.
- Δt = the minimal time interval between adjacent points in the trajectory, as defined by the frame acquisition rate.
- n = the step size.
- v = the displacement, which is technically a vector.
- α = angle.
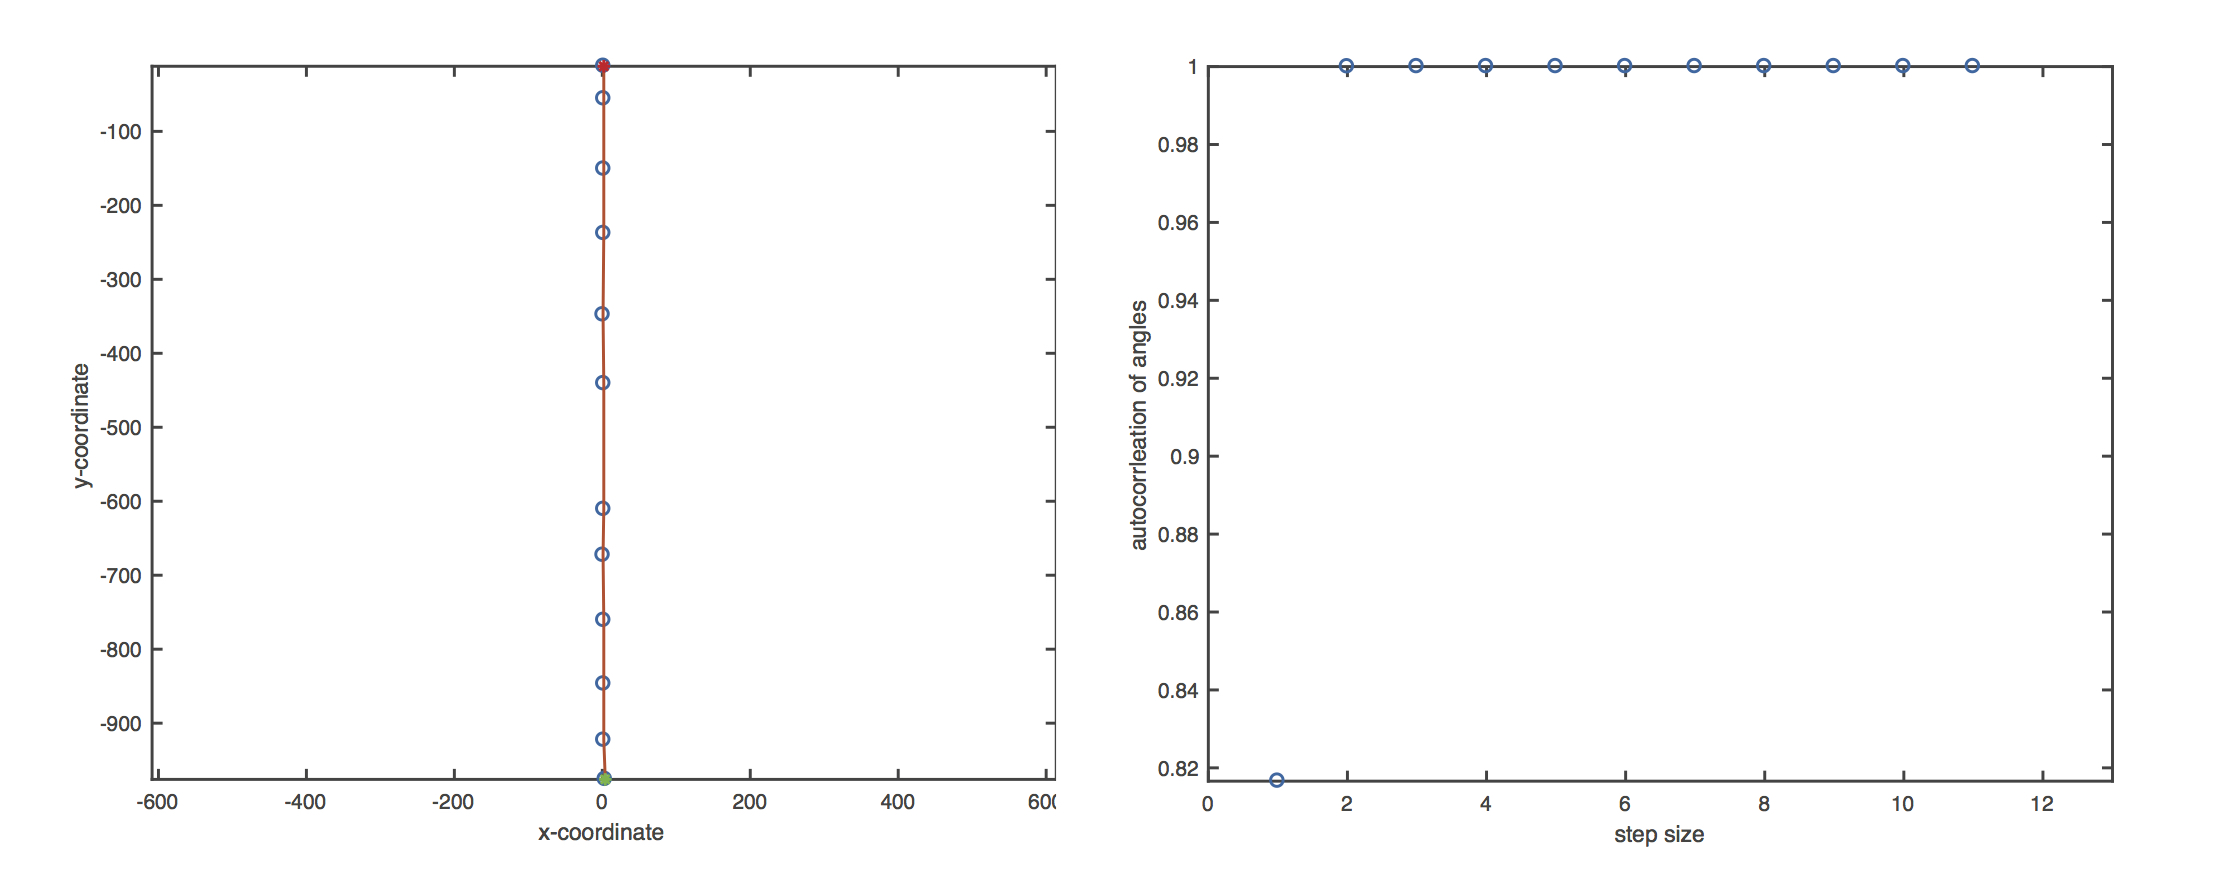
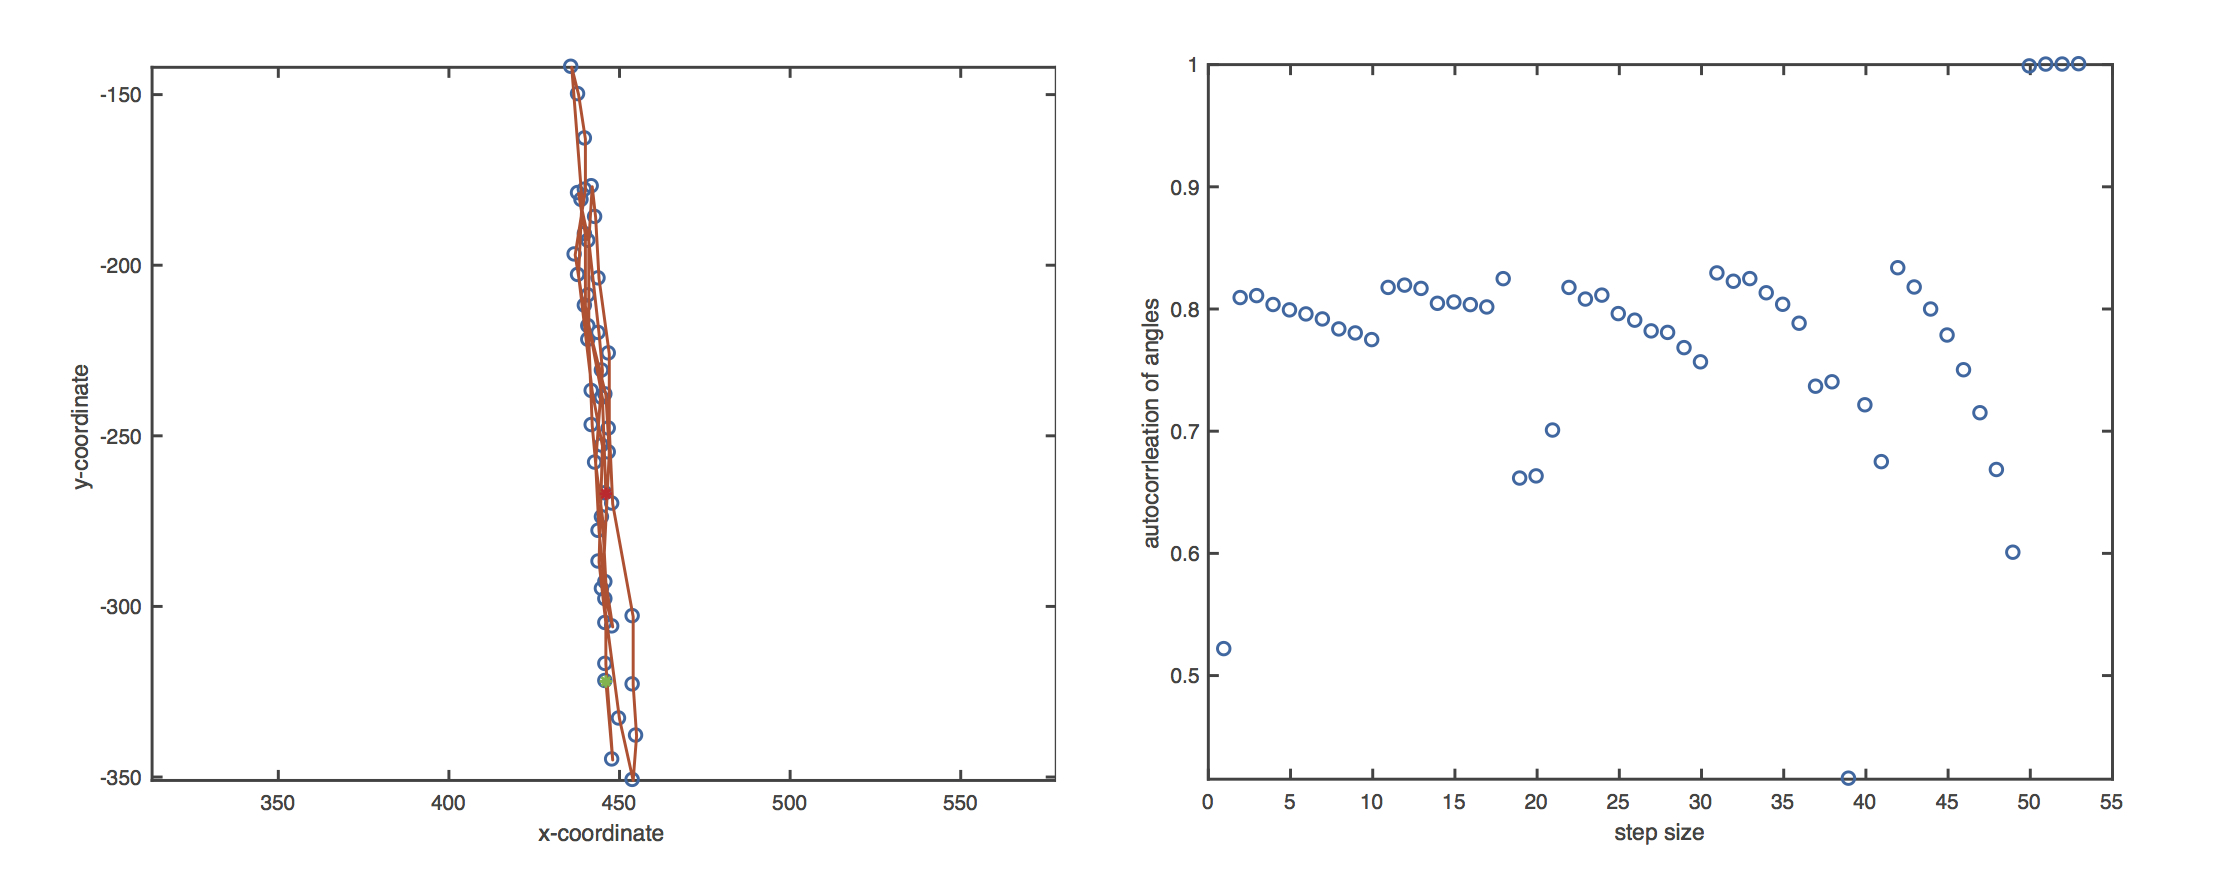
Example: cell moved persistently in one general direction.
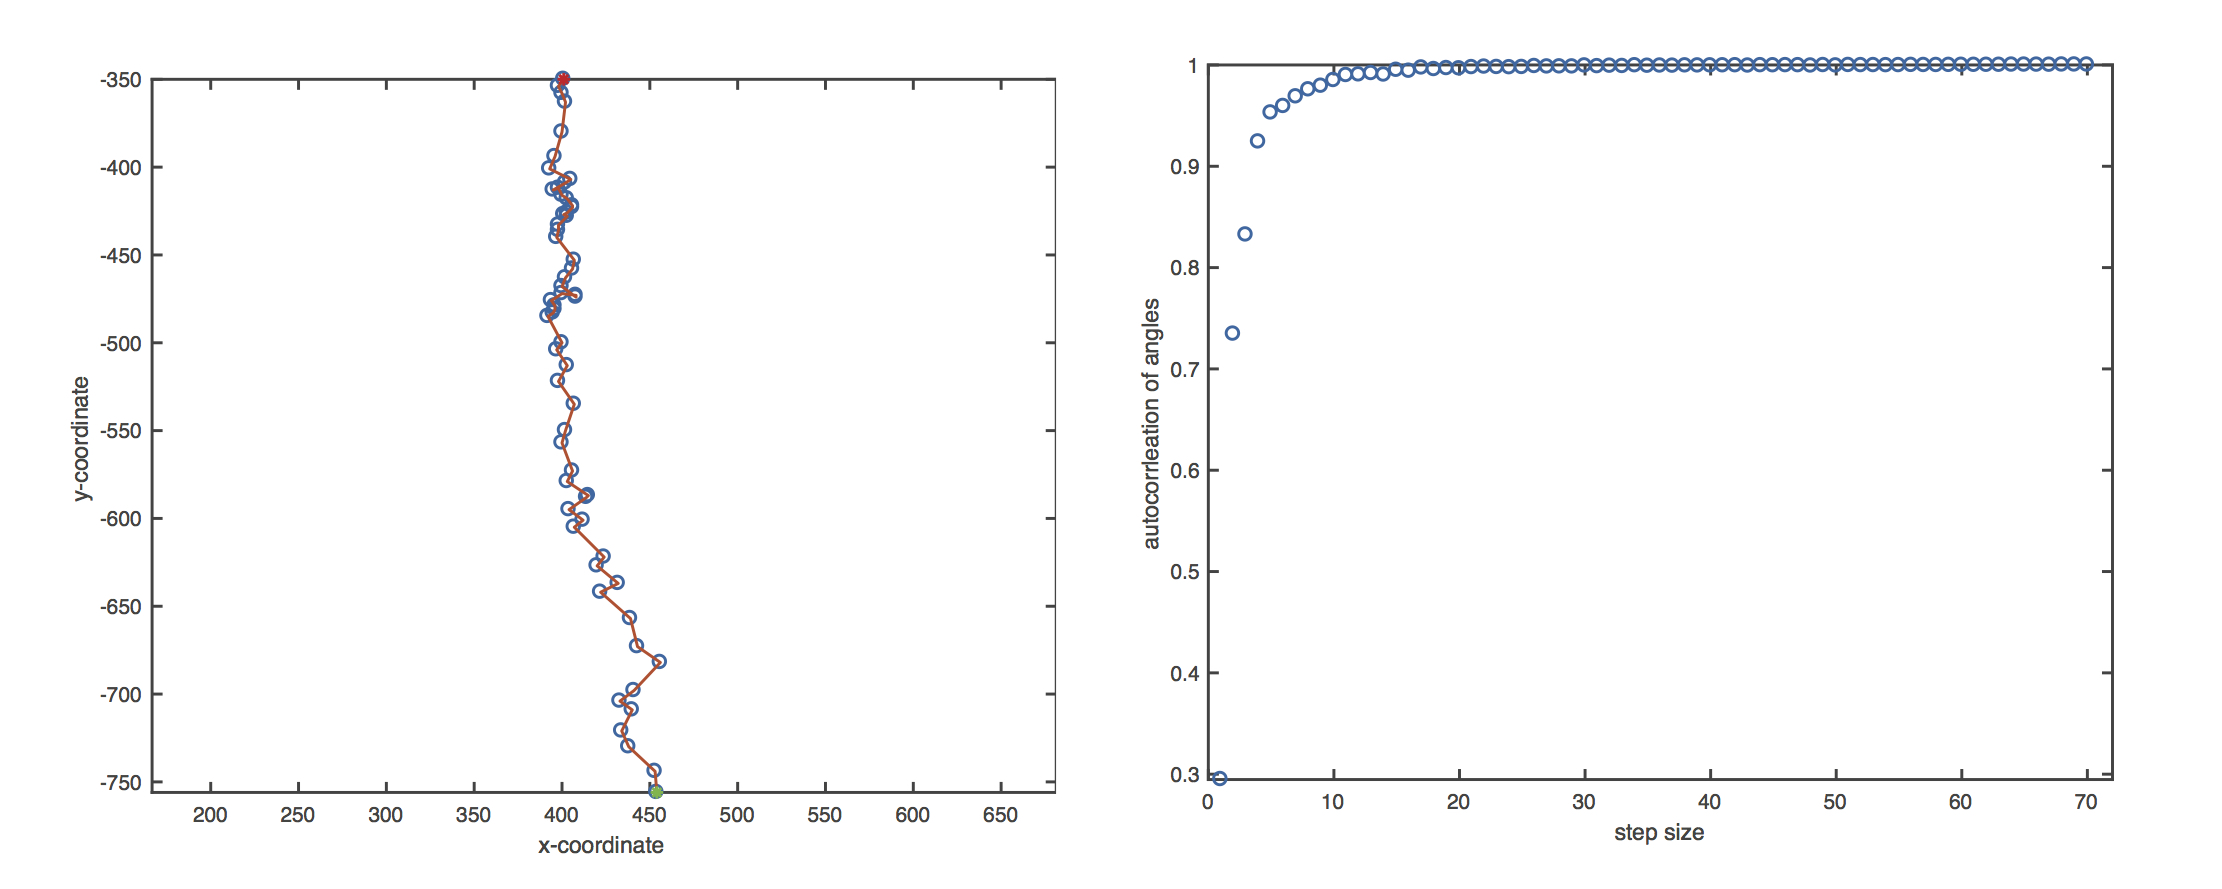
Example: cell moved persistently in one general direction, but also jittered constantly.
Example: cell moved back and forth along the same track, turn every 10 steps.
Goal: We want to use the same tools that we have established to study the migration and the FN fibrillogenesis of fibroblast, as fibroblast is the implicit gold standard for studying FN fibrillogenesis.
Some interesting highlight from recent literature:
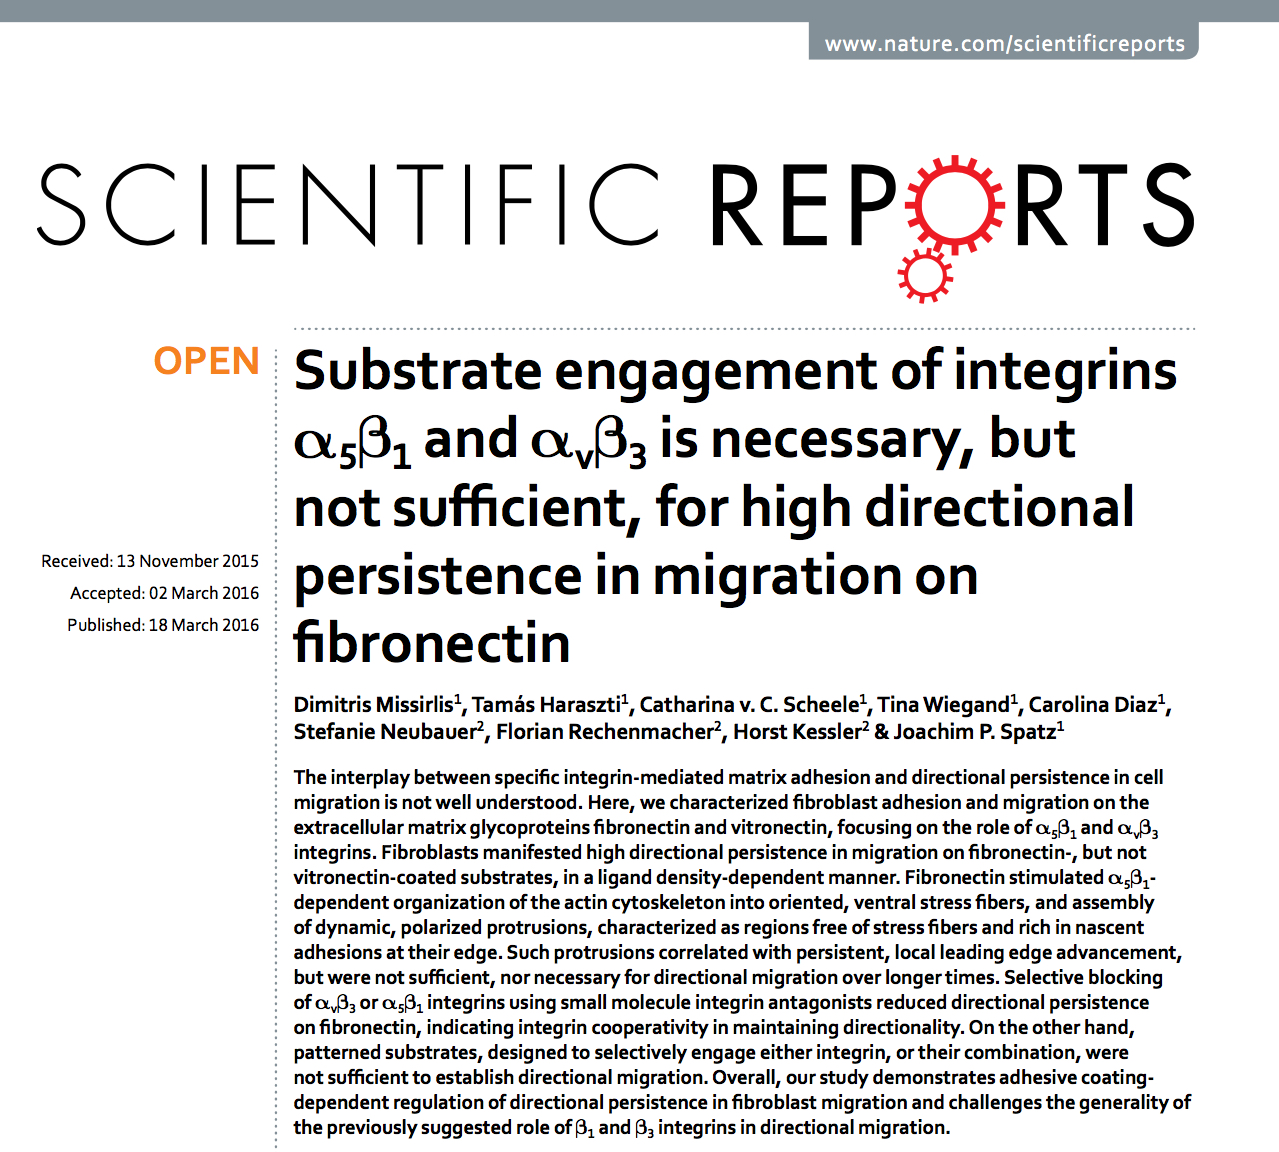
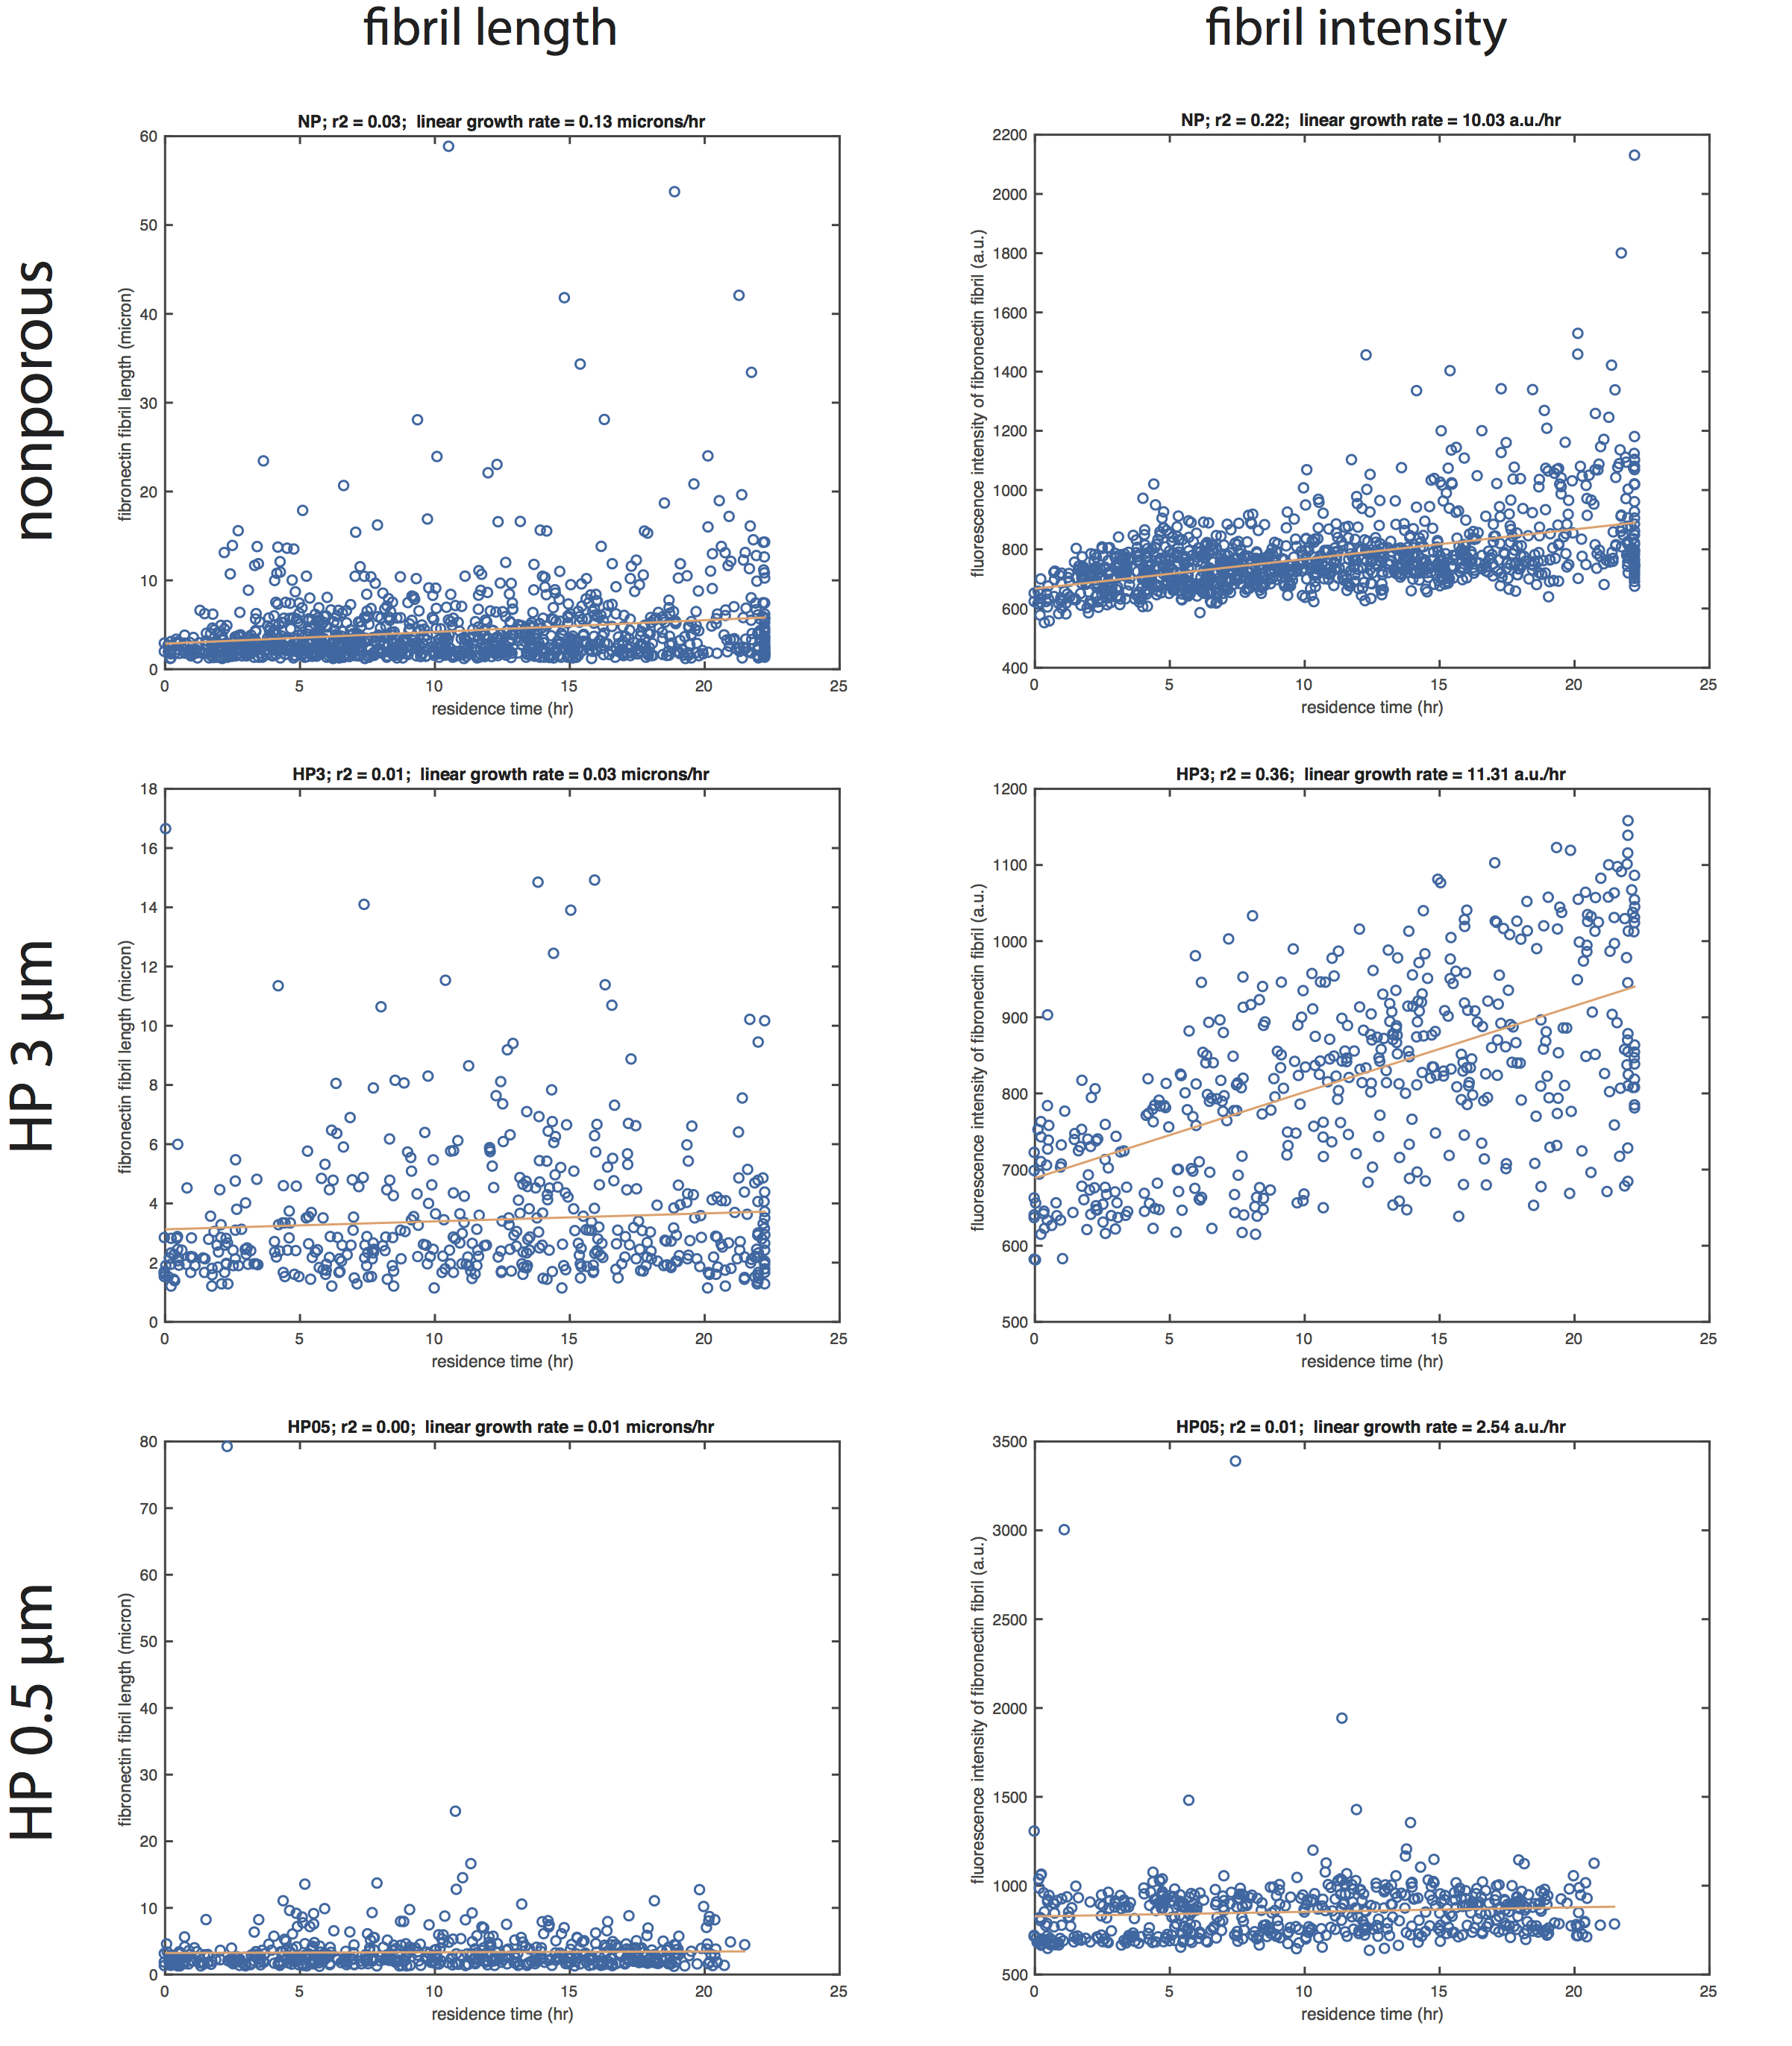
Some cool data preview (this is for HUVEC, but we will do so for fibroblast, along with a model):
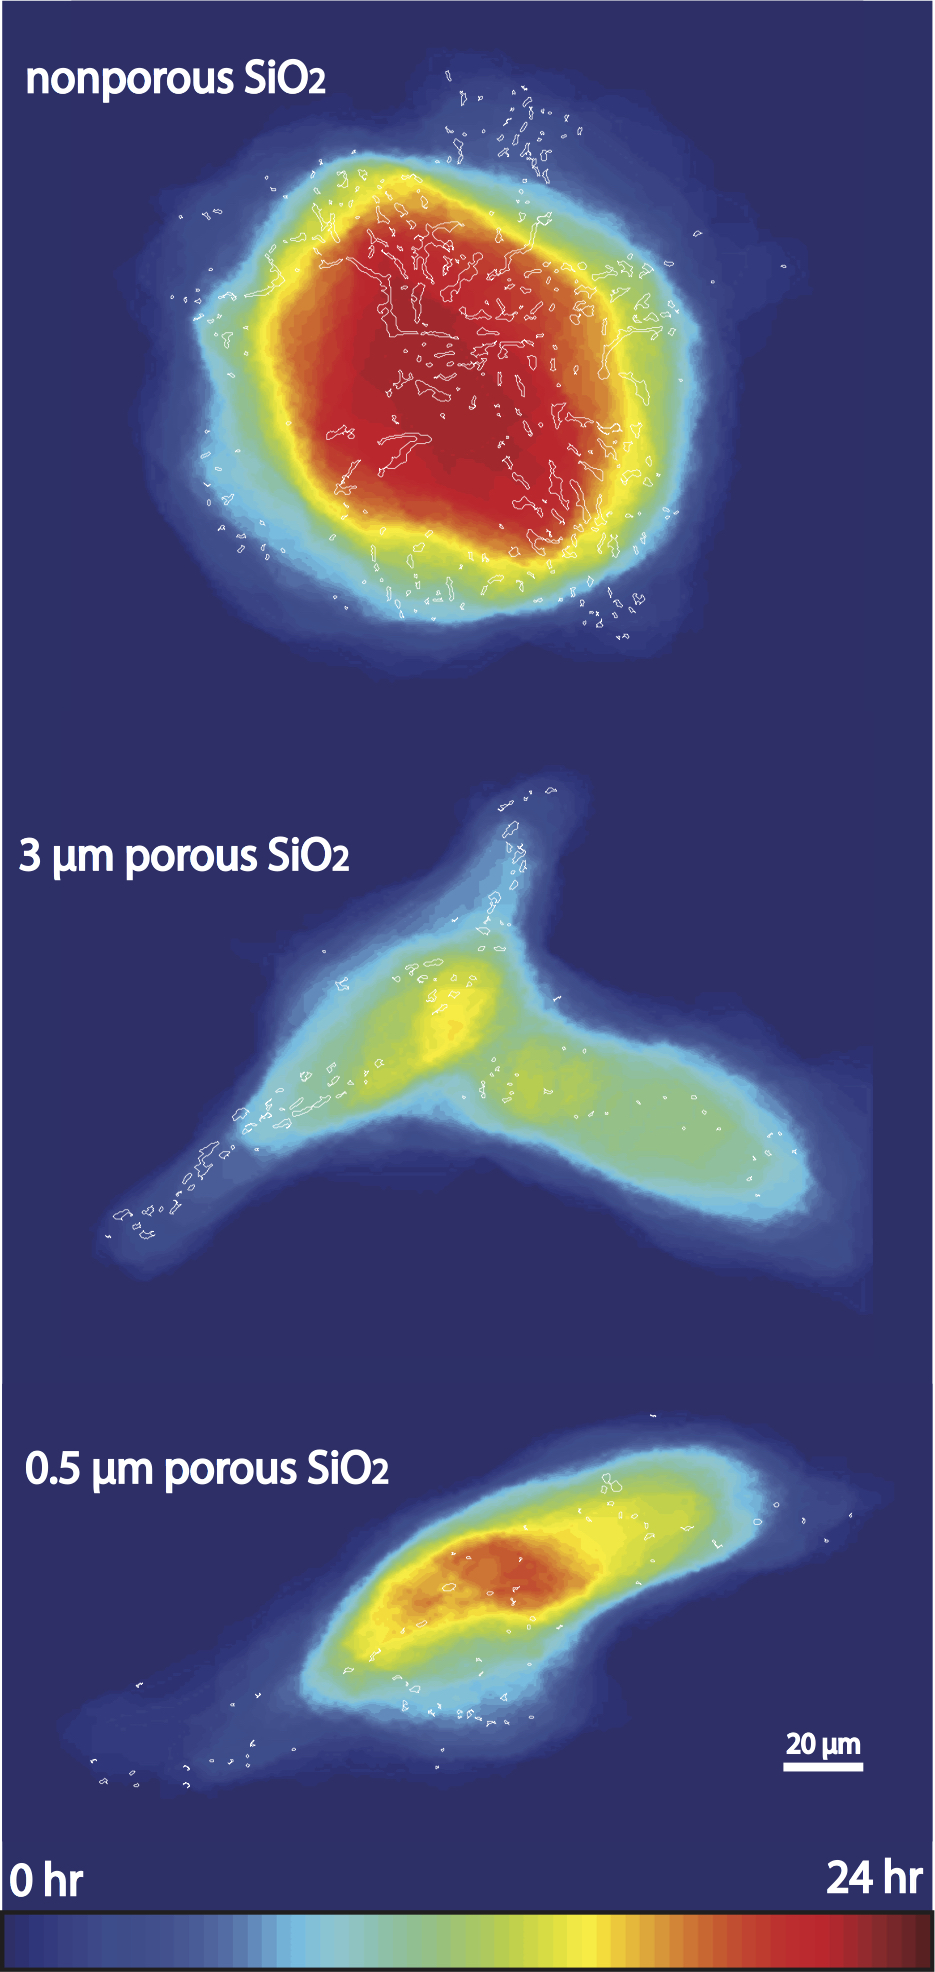
Fibronectin fibril lengths in relation to the cell residence times on the different substrates. The outlines of fibronectin fibrils (white) were overlaid onto the “heat map” of cell residence times (blue and red denote the 0 hr and 24 hr, respectively). The cell on top (on the nonporous SiO2) presented an extreme scenario in which the cell remained stationary, but expanded and contracted repeatedly. The representative cell on the 3.0 μm porous SiO2 migrated quickly from right to left, then moved at a slower speed back and forth along the 45° diagonal. The representative cell on the 0.5 μm porous SiO2 traveled along the 30° diagonal from left to right, then stayed mostly on the top right corner.