Current Dialysis Research [McGrath Lab, December 2017]
Introduction
The on going work for the dialysis project at UR has undergone changes and many hours of trouble shooting over the past semester. We are at a point now that I would like to share all the work I have done up until this point including assay development, method progression, and the experiments we have already performed and plan to perform (in vitro) to complete our preliminary dialysis research. Our rotation student (Lindsay) will also be sharing her research in the coming weeks as well. Overall, we have developed two main experiments that will elucidate the necessary information about our membranes and devices to decide whether our membranes are suitable for in vivo studies.
Methods & Results
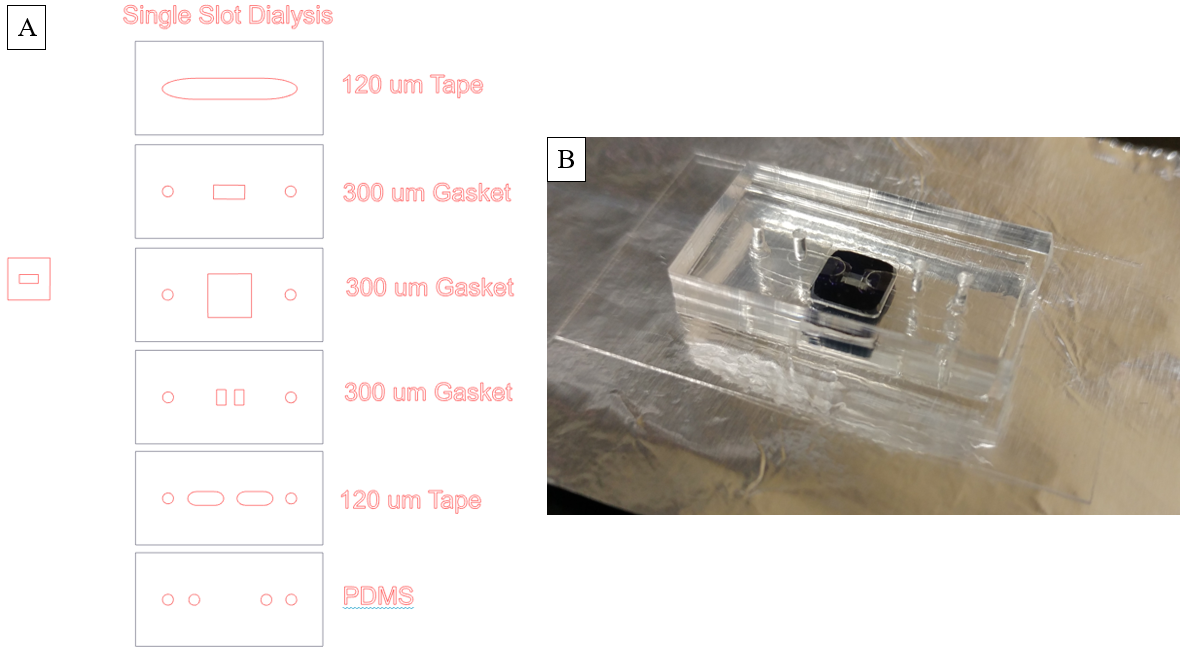
Device Design: The device design has been standardized for all bench-top dialysis work with a single slot membrane (Figure 1). Tape layers allow for easy extraction of the membrane for SEM.
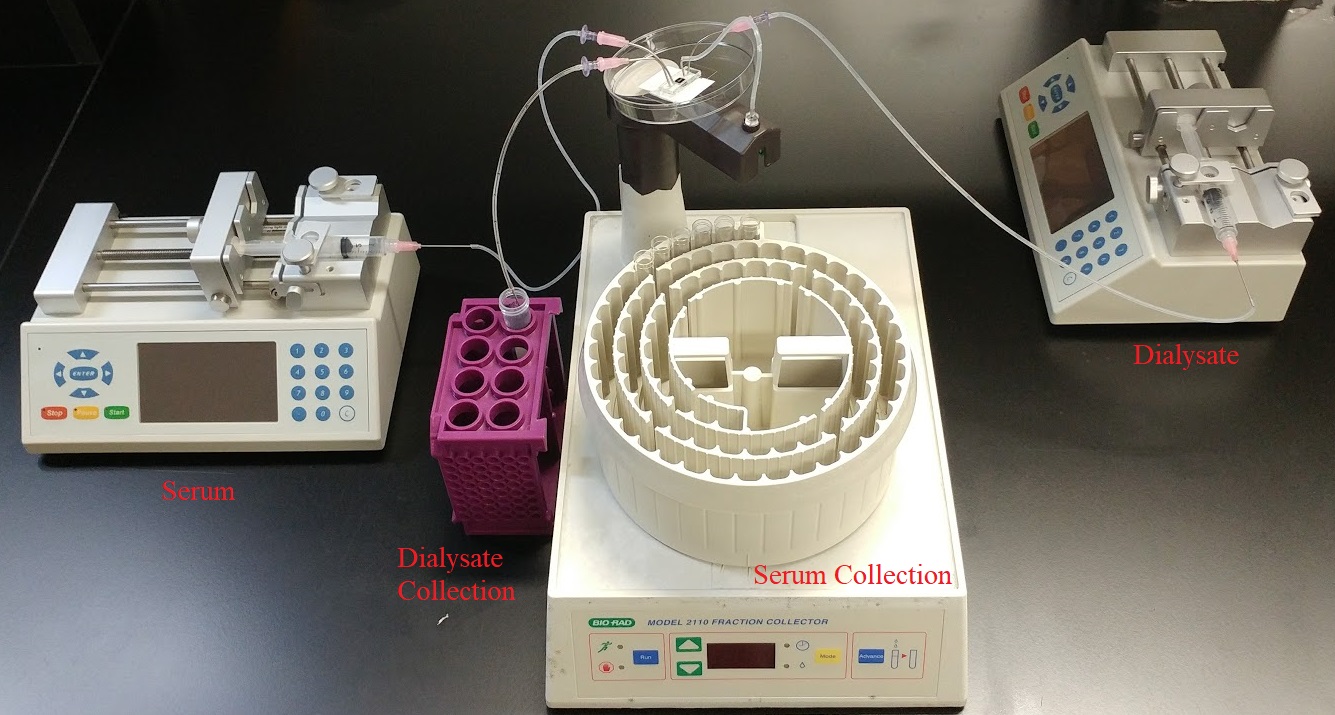
Multi-Pass Bench-Top Dialysis: The multi-pass experiments are essentially a equilibrium experiment in the dialysis format to probe for membrane selectivity of Albumin and Cytochrome C. Peristaltic pumps are utilized to circulate serum and dialysate through the device over the course of 2.5 days (Time point based on back of the envelope calculation determining time needed to allow cytochrome c diffusion to roughly 30% filtration). Serum is comprised of 1xPBS, 1mg/ml cytochome c and 1 mg/ml BSA while dialysate is 1xPBS. The format circuit includes a peristaltic pump, the device, and an air tight reservoir designed in lab. Biovision’s albumin assay is used to asses BSA levels in samples. Cytochrome c assay was developed in lab to eliminate background interference: Samples are diluted and absorbance is measured at 405 nm. A cytochome c standard ladder is used to asses final sample cytochome c levels. [Expect more information, images, and data on this experiment from Lindsay soon]
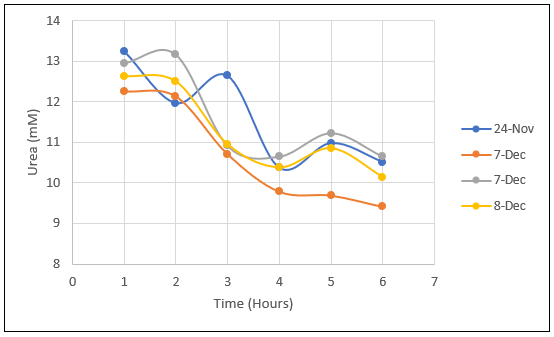
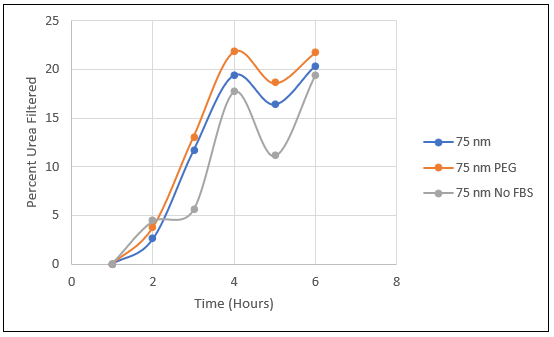
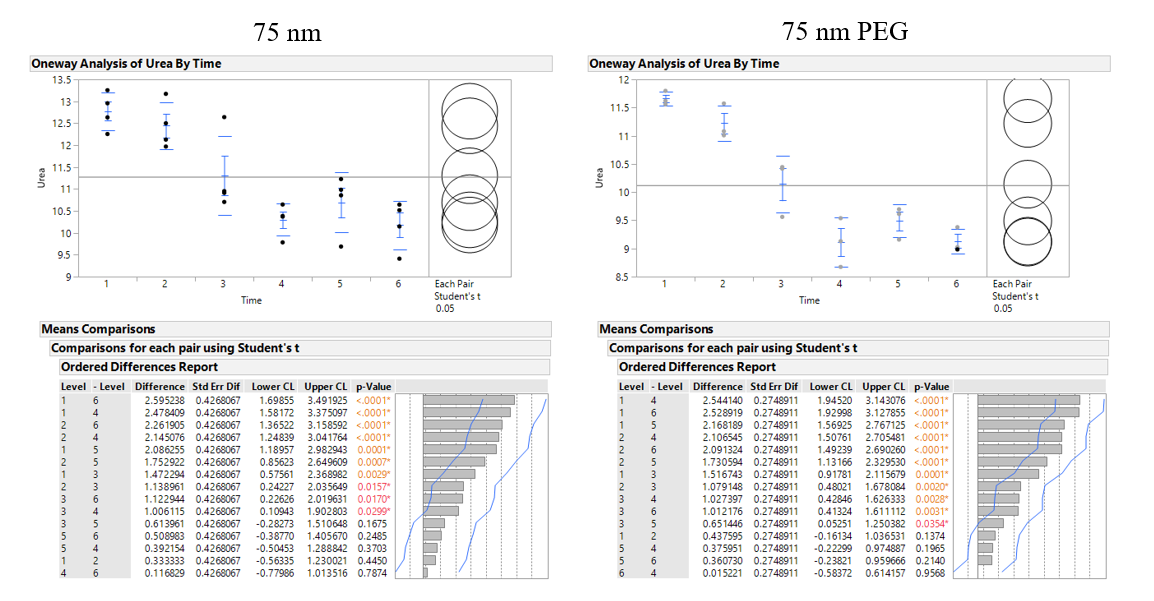
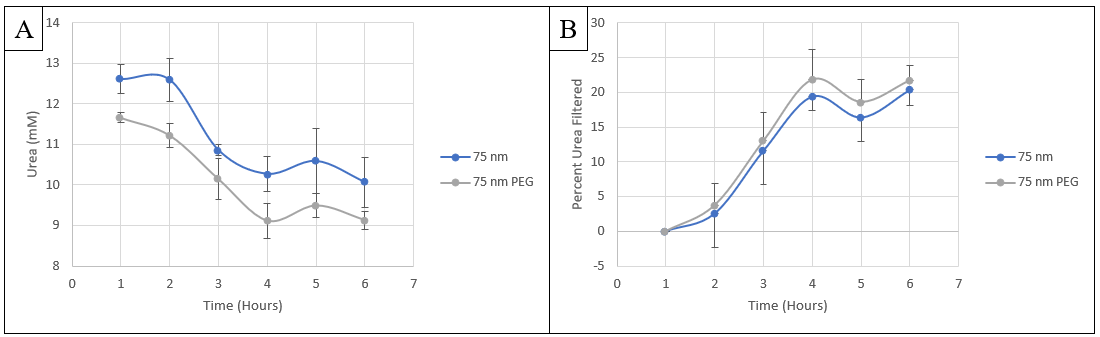
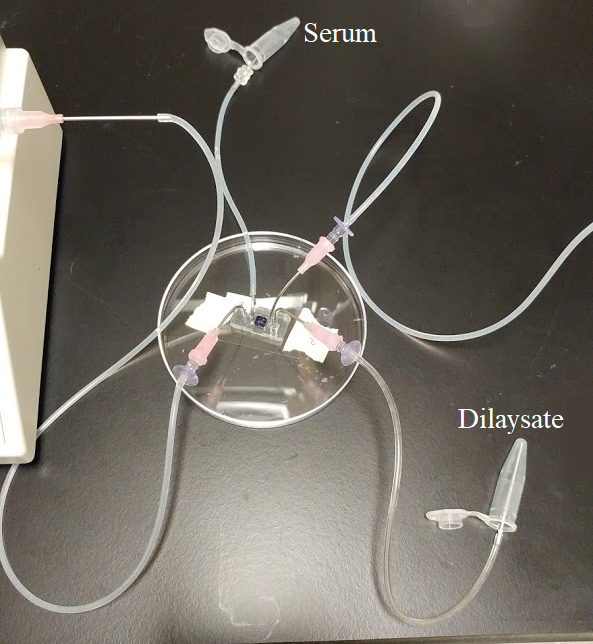
Ultrafiltration Troubleshooting: While the multi-pass set up is designed to prevent ultrafiltration, stickily probing the membrane selectivity, the single-pass format still has potential to allow for ultrafiltration. Since the bottom channel presumably has greater resistance than the top (based on geometry) and the bottom flow rate is higher, ti would not be unexpected to see ultrafiltration from the bottom channel into the top channel. To test the influence of ultrafiltration on our data, I set up a flow circuit that allowed me to accurately measure flow rates based on weight of fluid collected (Figure 4). “Serum” and “dialysate” flow rates were set to 100 ul/min and 200 ul/min respectively and ran for 2 mins. The fluid collection equated to 204.1 uL on “serum” side and 395.9 uL on the “dialysate” side. This gives us a flow rate through the membrane of 2.05 ul/min through the membrane (bottom to top). Assuming proportionality, this would influence our single-pass dialysis data by 2.01%. Since our actual filtration reaches into the 20-25% range, we believe ultrafiltration is not heavily influencing our data.
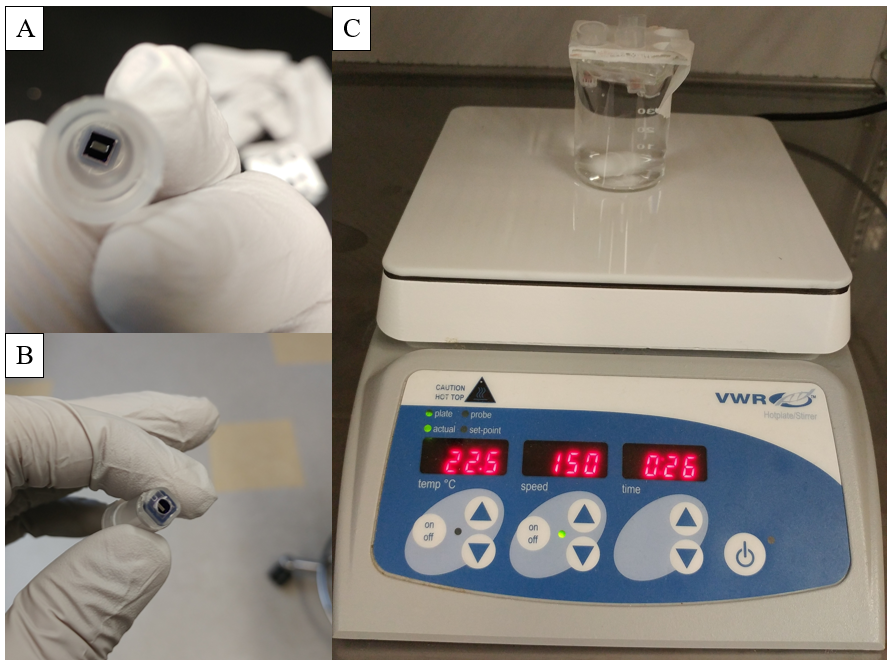
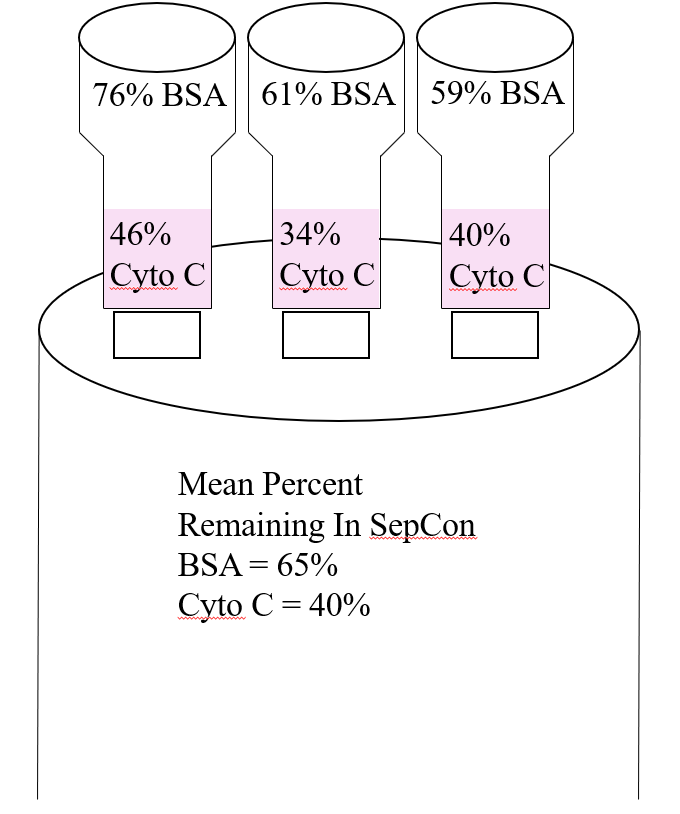
Albumin and Cytochrome C Separation In a SepCon Format (“Microdialysis”): While previous multi-pass experiments aimed to probe the NPN membranes for BSA and cytochrome C separation, pressure balance issues proved to be very problematic, leading to inaccurate results. To address this question without pressure issues, we switched to a open bottom SepCon based experiment that addressed separation through diffusion (Figure 5). “Serum” comprised of 1 mg/ml BSA and cytochrome C and PBS was introduced to the top of the column (50 uL) while a clean beaker was filled with PBS. The system was placed on a magnetic stir plate in the fridge and let to separate for 24 hours; enough time for both BSA and cytochrome c to diffuse through the membrane. Results showed significant reduction in both BSA and cytochrome c over 24 hours, more so for the latter (Figure 6). Overall, data suggests the membranes are less permeable to albumin then cytochrome c, a characteristic very beneficial for dialysis use.
Conclusion and Future Directions
While the data is still minimal, I believe we have successfully designed and perfected two experiments that will carry this portion of the UR dialysis project to well structured and defendable conclusions for publications to come, as well as guide future in vivo work. Plans to utilize pressure balancing systems with Vinay’s help are also in the works. Pressure balancing in real time is key to many current human dialysis machines and may bring another degree of “realness” to our bench-top set ups.
Supplemental Figures