GO Hemocompatibility Study: I. Hemolysis
Intro Recently we have been collaborating with the Moghaddam lab from the University of Florida, which specializes in the fabrication of graphene oxide (GO) membrane, to study the use GO membrane as a toxin filter or absorbent in hemodialysis and live support devices.
We are responsible for the hemocompatibility component of the study and used the following FDA document as the guideline ([primer] FDA guide to use of ISO 10993-1). In brief, there are not set standards as to how the hemocompatibility testing should be conducted, but the testing should include hemolysis, coagulation, and immune activation. For hemolysis testing, we followed the ASTM guideline ([primer] ASTM F756), using the hemoglobin (Hb) measurement recommended by Dr. Richard Malinauskas of FDA ([primer] Malinauskas 1997 REVIEW plama Hb measure for medical devices).
Methods: Whole blood with sodium citrate were tested in accordance to: [Official Report] Hemolysis Test
NOTE: We bought whole blood from Zen-Bio (http://www.zen-bio.com/products/serum/human-blood-products.php). Product code: SER-WB (to buy 1 unit/450 mL of whole blood) + SER-SOCIT (with Sodium Citrate as the anticoagulant). Without specifying, SER-WB already comes with Acid Citrate Dextrose (ACD), which is one of the safest anticoagulant. Blood should be used within 28 days upon receipt, as recommended by the Zen-Bio.
Results
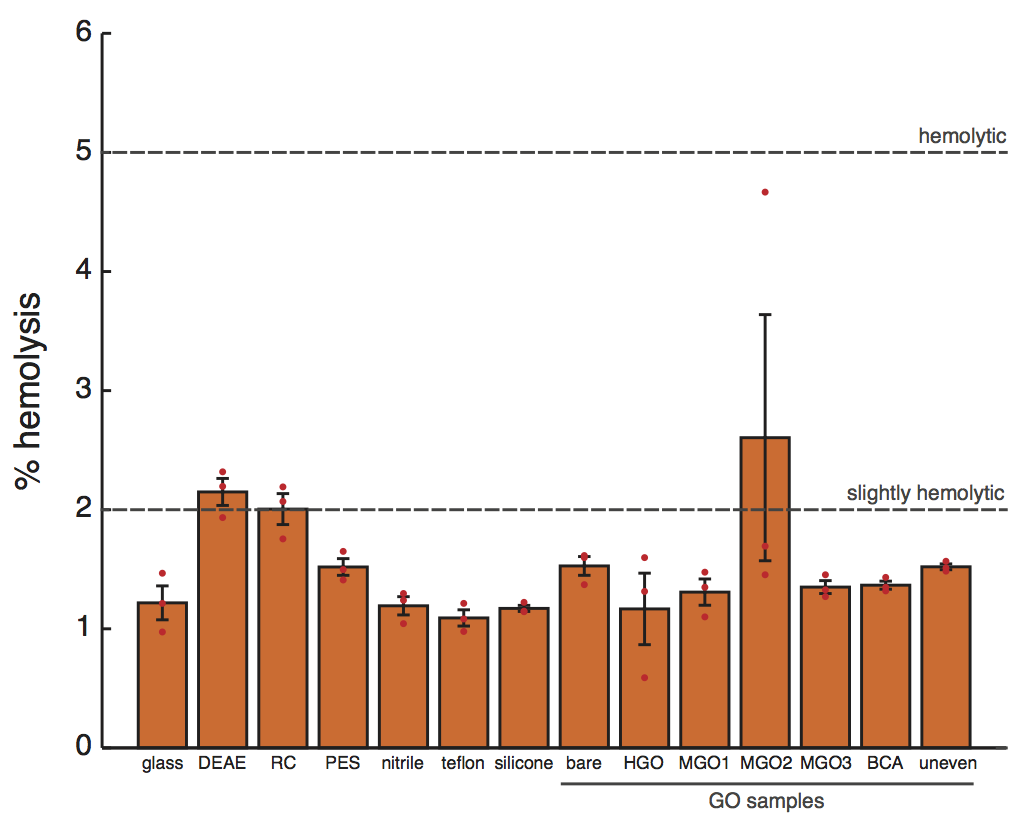
Figure 1. Hemolysis seen on different substrates. The bars and error bars represent the means and the standard errors, respectively (n = 3 for each substrate type). The red dots are the actual data. The top and bottom dashed lines denote the 5% and the 2% level of hemolysis. In accordance to ASTM F7563, >5% is considered hemolytic, 2%-5% slightly hemolytic, and <2% is non-hemolytic. Note that the 2% and 5% level are arbitrarily chosen, as acknowledged by ASTM. We removed one anomalous sample from the MGO2 group and performed one-0way ANOVA with Tukey-Kramer post hoc procedure for pairwise comparisons (α=0.05). DEAE cellulose is statistically different from all substrates, and regenerated cellulose statistically different from all substrate except PES, bare, MGO2, and uneven. No differences are seen otherwise.
The control substrates tested are:
- glass (VWR Cat No. 48300-025)
- DEAE: DE81 grade chromatography Diethylaminoethyl cellulose (Whatman® Cat No. 3658-325)
- RC: 100 kDa Regenerated cellulose (Ultracel® Cat No. PPLHK02510)
- PES: 100 kDa ultrafiltration polyethersulfone (Biomax® Cat No. PBHK07610)
- nitrile: Lab gloves (Microflex® Cat No. N192)
- teflon: CS Hyde Cat No. 15-20A-1.5-5.
- silicone: restricted grade*w1 silicone (from Specialty Silicone Fabricators).
The test substrates are: Bare (the glass on which GO is grafted onto. In a sense, the background). HGO, MGO1, MGO2, MGO3, BCA are the different treatments/methods of GO grating onto bare. Uneven consists of imperfect samples, likely without a uniform GO grafting.
NOTE: 1. ASTM recommends completely immersion of the sample in blood in a polystyrene or glass tube at a surface area to volume ratio of 6 cm2/mL, for at least 3 hr at 37 °C. Our experimental setup: a surface area to volume ratio of 5.36 cm2/mL; 2 hr at 37 °C. For the control substrates tested on earlier experiments, we also have data at the 4 hr time point (which is almost the same % hemolysis as seen at 2 hr, but with more occurrence of coagulation). 2. The DEAE, RC, and PES samples are actually circular. So I scissored the circular samples in half and placed the two halves within the housing (“FAT” TeflonTM with the rectangular silicone frame). The true area of the circular samples is around 4.9 cm2, ~2% less than the 5 cm2 of other samples. 3. There is also a sidedness to the RC and PES samples. I placed blood on the smooth side (which is more hydrophilic and has smaller pore sizes). With 0.5 mL on each of the half, there is not enough hydrostatic pressure to drive the blood through to the other side actually. There is some concern that there are differences in hemocompatibility between the two sides. And that the smooth side may be smooth due to surface treatment (e.g. ), which may degrade and leach into blood to compromise hemocompatibility. Later I found out that the rougher size is intended filter out cells and cell lysate.w2 We will investigate the sidedness and the effects of prewash with PBS (to remove leachant) next time. 4. I did not account for the slight (~2%) variation in area, nor did I subtract out the teflon and the silicone frame background for the control substrates. Most of the times the blood did not see the housing.
* Restricted grades of medical silicones are class VI materials and have the required testing performed including systemic toxicity, intracutaneous toxicity and muscle implantation. These liquid medical silicone have exhibited superior compatibility with human tissues and body fluids and an extremely low tissue response when implanted. The length of implant is generally less than 29 days although it may vary accordingly to the liquid medical silicone manufacturers. For any applications used inside the human body, a material supplier agreement should be verified for any restriction prior to fabrication. An example of the supplier agreement would be Wacker Health Care Guidelines that states the length of implant, usage responsibility, and the restrictions on certain applications such as contraceptive or reproductive devices.
Additional Studies: There are reports that high concentration of GO (e.g. when dissolved in blood) can actually bind away the Hb to reveal no hemolysis (reference:Monasterio (Goni) 2009 GO-induced hemolysis and related artifacts):

In this case, we can determine the Hb in advance and incubate the sample with known Hb on the substrates to assess the degree of Hb binding. And use this data for correction to determined the true % hemolysis, as done by Monasterio et al.
What’s next? Study of Platelet aggregation.
====================================================================
NOTE: this is just the protocol from the document, copy sand pasted onto the blog post for ease of viewing.
Blood Preparation
1. Let blood warm up to room temperature.
2. Optional: Check for blood clot through pouring into the proper container (i.e. polypropylene tubes). If necessary, clot can be removed with an appropriate filter through pouring.
3. Determine the hematocrit.
The hematocrit is the proportion, by volume, of the blood that consists of red blood cells. The hematocrit (hct) is expressed as a percentage. For example, a hematocrit of 25% means that there are 25 milliliters of red blood cells in 100 milliliters of blood. Hemotocrit can be determined using the following two methods:
Method 1 (the preferred method): Centrifugation.
Pipette 100 μL of blood onto a piece of parafilm or into a microcentrifuge tube, then connect one end of the hematocrit capillary tube to the blood. After drawing a sufficient length of blood into the hematocrit capillary tube (recommended by the black, blue or red marks on the hematocrit capillary tube), cap the end of the tube that was connected with the blood with clay. Spun the blood-loaded hematocrit capillary tube using a hematocrit centrifuge for at least 5 min to separate the blood into two layers: The red blood cell (RBC) layer (red) and the plasma layer (yellow).
Hct = 100 × the length ratio of the RBC layer to the total.
Method 2: Spectrophotometry
Hct can be determined indirectly through the hemoglobin count (Hb)1:
Hct = 3 × Hb
This approach, however, is less accurate since the hemoglobin content may vary in RBCs (i.e. in the case of anemics). Furthermore, this method will detect both the hemoglobin in the RBCs and the free hemoglobin released into the blood by lysed RBCs. Hb itself can be determined through spectrophotometry. Reagent can be added to a defined volume of blood to generate colored proteins, which can then be counted through spectrophotometry. Alternatively, Hb can be determined directly through spectrophotometry, since Hb is bright red itself. The preferred method for Hb determination, in the publication by Richard Malinauskas of FDA (Food and Drug Administration), is the Cripps’s method2:
Hb = 177.6 × [A576.5 – (A560 + A593)/2]
The same publication also recommended the direct measure of Hb, as the addition of reagents can introduce complications.
4. Adjust the Hct to 36% for every experiment. This helps ensure similar baseline for all experiments (not all donors have the same concentration of RBCs in blood). This adjustment can be done through either plasma removal to concentrate or dilution with HBSS or PBS. The following formula is used to determine the final sample volume required for the adjustment:
Hcti × Vi = Hctf × (Vi – Vs)
where Hcti and Hctf are the initial and the final hematocrit, Vi is the initial volume, and Vs is the volume to be subtracted for concentration. Typically, a Hct of 36% requires concentration. If Vs is negative, dilution with Vs of HBSS or PBS is required.
Example: Adjusting the sample to a Hct of 36% if given 500mL of blood with a Hct of 27%.
0.27× 500 mL = 0.36 × (500 mL – Vs) gives Vs of 125 mL. So 125 mL of plasma needs to be removed.
Sample Incubation with Blood
Our sample comes in the format of a coated glass slide. Due to the manufacturing process involved in preparation of the samples, the front side, the top portion, and the backside of the samples are not the same. We created custom-cut silicone frame (300 μm-thick, 5.8 cm x 1.8 cm, with 5 cm x 1 cm cutout in the middle) to hold the blood on top of our sample for incubation. The surface area of the silicone gasket (from the 4 walls) is ~7% of the total surface area that will be exposed to blood.
Pipette 1 mL of the hematocrit-adjusted blood (Hct = 36%) onto each sample.
– For hydrophilic samples, 1 mL of blood covers the entire inside of the gasket with ease.
– For hydrophobic samples, the blood tends to bead up instead of spreading on the sample. The blood can be spread to wet the entire inside through gentle tilting of the samples. Alternatively, pipette 2 mL of the blood onto the samples to wet the entire inside of the gasket, then remove 1 mL of blood from one corner of the gasket).
The sample to be tested is placed into a petridish, with Kimwipes (wetted with DiH2O) placed around the sample to reduce the evaporation of blood on the sample. Carefully place the petridish (with its lid on) into the incubator (80% humidity, 37 °C, 5% CO2) and let incubate for 2 hr.
NOTE:
- With 1 mL of blood, we have a total surface area to volume ratio of 5.36 cm2:1 mL. This is similar to the 6 cm2:1 mL recommended by ASTM F7563.
- The ASTM F7563 also recommends an incubation time of 4 hr. I decided to do 2 hr instead since sometimes blood coagulation can occur at the 4 hr time point.
Hemolysis Measure of the Sample-incubated Blood
Retrieve the sample-incubated blood onto a piece of parafilm, then mix the blood and pipette 700 μL of the sample-incubated blood into a 1 mL microcentrifuge tube. Spin for 500 g for 20 min. Retrieve the top 200 μL of plasma and spin the plasma sample one more time at 3,000 g for 10 min to further ensure the reduction of RBC (a red pellet will be seen). Take the top 100 μL and place in a 96 well plate for spectrophotometry. Determine the Hb using the Cripp’s method for the measure of hemolysis. A representative data from a control study is shown below.
 Note the importance of a higher rcf 2nd spin.
My simple testing indicated that the Hb for samples with a 500 rcf 2nd spin is 30% larger than the Hb for samples with 3000 rcf 2nd spin.
% hemolysis = (S – B)/ (T – B) x 100
where S = Hb of samples, T = Hb of lysed sample, and B = Hb measured right at the beginning of the experiment.
The lysed sample is obtained by diluting the whole blood 1:5 in DiH2O and let sit for 2 hr at room temperature. Since the Hb level is so high in the lysed sample, often there will be signal overflows during the spectrophotometry measurement. After the 2nd spin, I dilute the lysed sample by a factor of 3 again prior to spectrophotometry (to bring the Hb level down to around the 150 mg/dL range). I then multiplied the Hb measured by the total dilution factor of 15 to get T.
Journal References
(1) Carneiro, I. A.; Drakeley, C. J.; Owusu-Agyei, S.; Mmbando, B.; Chandramohan, D. Haemoglobin and Haematocrit: Is the Threefold Conversion Valid for Assessing Anaemia in Malaria-Endemic Settings? Malar. J. 2007, 6 (1), 67 DOI: 10.1186/1475-2875-6-67.
(2) Malinauskas, R. a. Plasma Hemoglobin Measurement Techniques for the in Vitro Evaluation of Blood Damage Caused by Medical Devices. Artif. Organs 1997, 21 (12), 1255–1267 DOI: 10.1111/j.1525-1594.1997.tb00486.x.
(3) ASTM. Standard Practice for Assessment of Hemolytic Properties of Materials 1. Practice 2013, i (April), 1–5 DOI: 10.1520/F0756-08.2.
(4) Monasterio, B. G.; Alonso, B.; Sot, J.; García-Arribas, A. B.; Gil-Cartón, D.; Valle, M.; Zurutuza, A.; Goñi, F. M. Coating Graphene Oxide with Lipid Bilayers Greatly Decreases Its Hemolytic Properties. Langmuir 2017, 33 (33), 8181–8191 DOI: 10.1021/acs.langmuir.7b01552.
Web References
W1: https://albrightsilicone.com/restricted-medical-silicone/