From nanosphere self-assembly to free-standing membranes
We are working on finishing up a manuscript on our nanosphere lithography work. this post shows some of the figures for said publication. This paper includes work done with 300 and 200 nm NS as preliminary work, and then focuses on 200 nm NS only to evaluate the porous pattern obtained. From the data presented, a final optimized membrane will be fabricated, targeting pore sizes around 100 and 50 nm.
We start by describing the membrane fabrication process, some small changes have been done to this figure to better describe the transferring step from which large size defects originate.
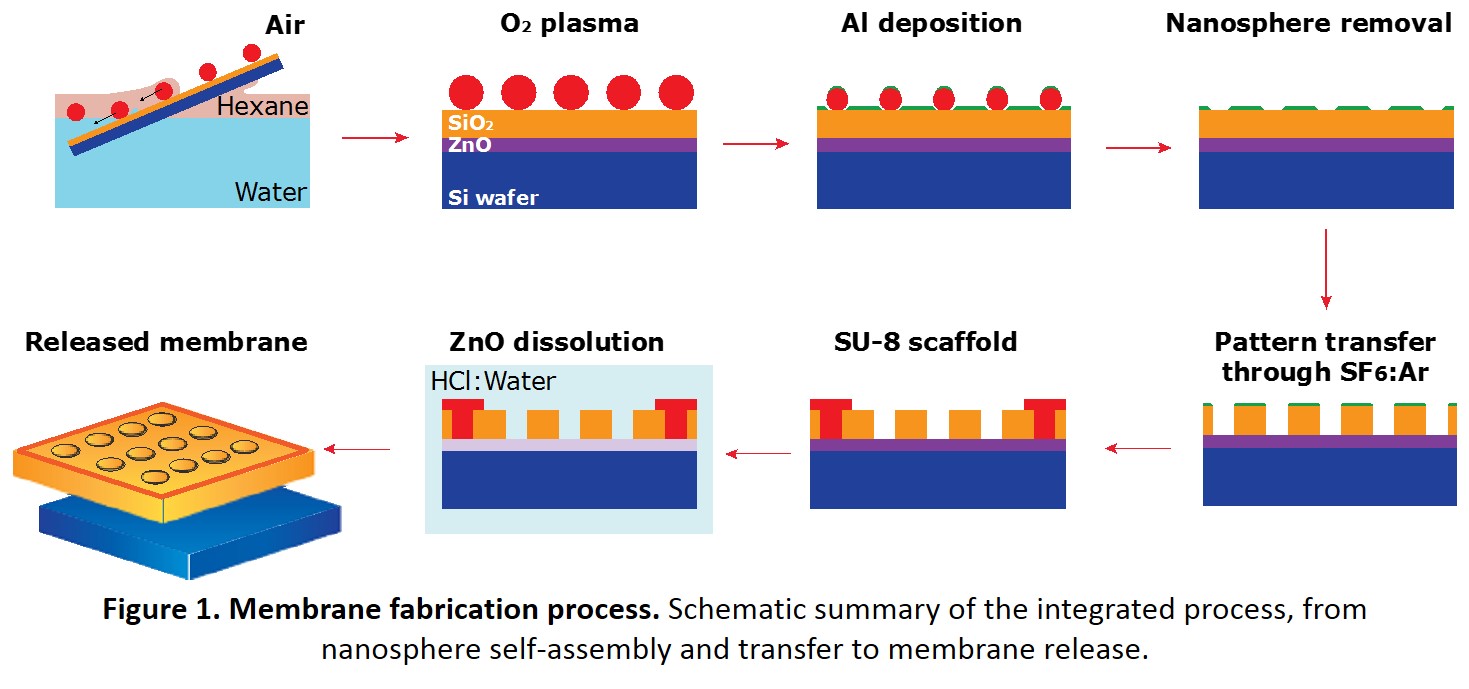
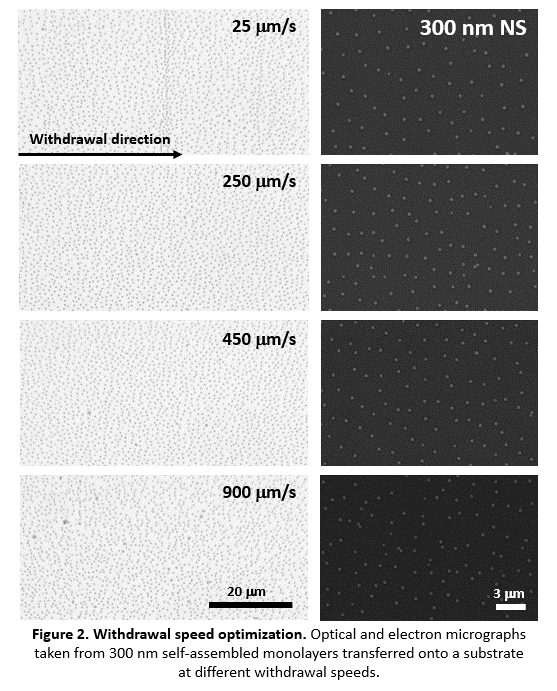
Figure two shows the optimization of one important parameter during transfer, withdrawal speed. It shows optical and electron micrographs from assembled 300 nm NS transferred at different speeds from 25 to 900 um/s. At slow speed, the monolayer of NS “folds” as it is transferred onto the wafer, creating stripes and stretching the monolayer. As a result the interparticle distance varies and aggregation occurs. A similar effect occurs at high speed, only in this case the monolayer stretches first as it deposits on the wafer, NS accumulate at the liquid interface and are then transferred as well. The high speed also traps water droplets underneath the hexane, which contributes to aggregation upon drying. Equivalent information for 200 nm NS will be included in the supplemental info.
Next, we present a figure to show the NS size as function of reduction time (in Oxygen plasma) for 200 and 300 nm NS as well as electron micrographs of the reduced 200 nm NS from a 45o tilt. Since this step in the fabrication is used to tune pore size as well as to minimize the defect concentration, we included electron micrographs from the Al masks produced where features go from merged doublets to a cluster made of single pores.
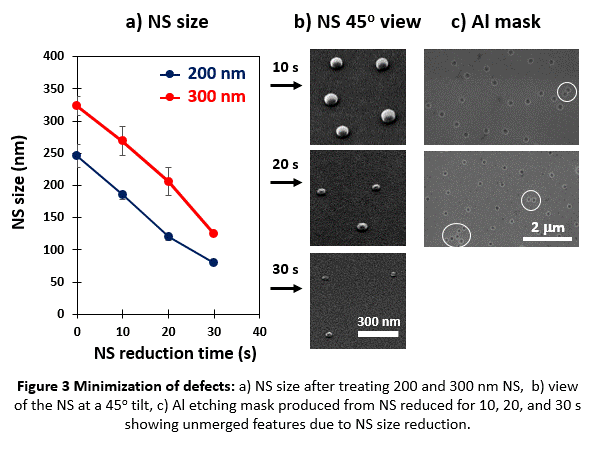
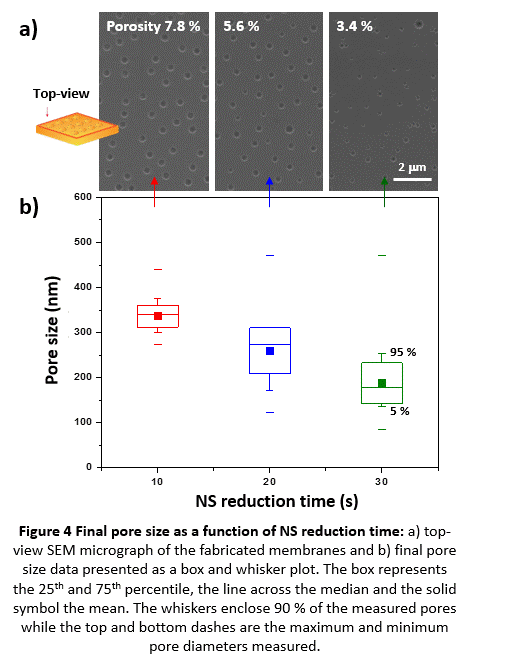
Figure 4 is where it gets interesting. This figure relates the final pore size to the NS reduction time and shows top-view electron micrographs of the samples. In this case, we present only samples from 200 nm NS. From the electron micrographs is clear that the pore size distribution spread as the NS reduction time increases, this is presented in panel b) as a box and whisker plot. The average pore size decreases as expected, even 90% of the data follows the trend. However, the largest pore size stays constant. We decided to track the evolution of the feature sizes throughout the fabrication process (see next figure).
This figure will compare the sizes of the Al coated NS (reduced), the size of the pores in the Al mask (after removing the NS), and the size of the pores in the membrane. Up to know, it seems that overetching is contributing to the larger membrane pore size. However, overetch does not explain the largest pore size and why they remain constant for the three samples.
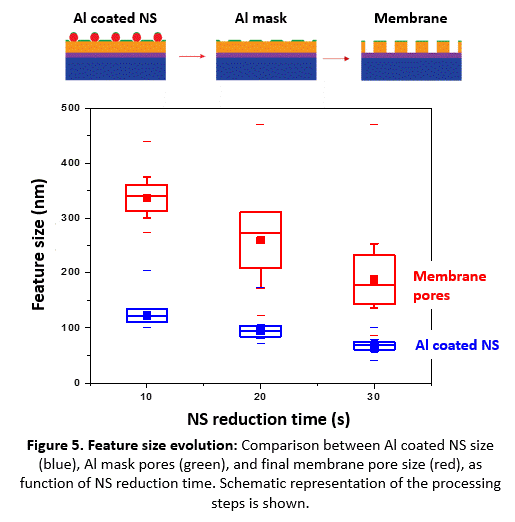
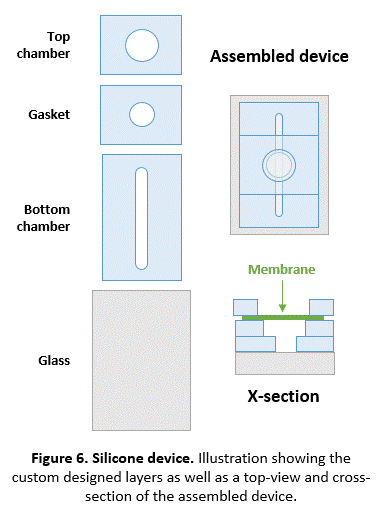
Figure 6 will show a membrane integrated into a silicone device to evaluate separations performance. We are currently working on this with some partial success.
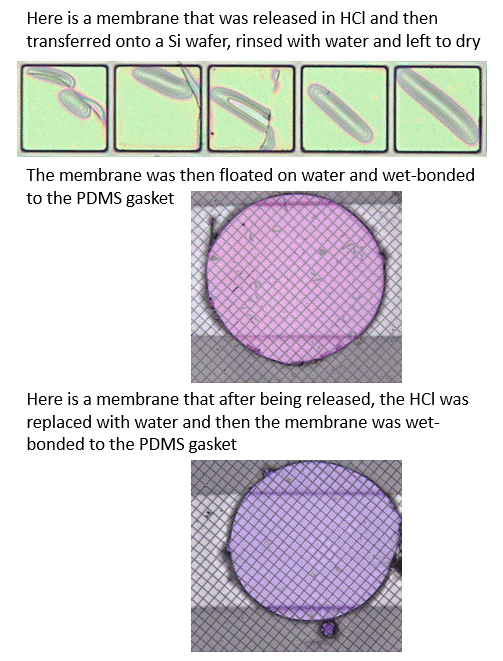
After releasing the membrane, the HCl is replaced with water and the membrane is wet bonded to the partially assembled device (glass+bottom chamber+gasket) and allowed to dry under a lamp. This approach yields the best results so far. If the membrane is released, rinsed, and left to dry, the concentration of tears increases. I believe this is due to static pulling the membrane to contact the Si wafer where the membrane sits to dry. The pulling is non-uniform which causes pillowing and consequently tears form (see below).
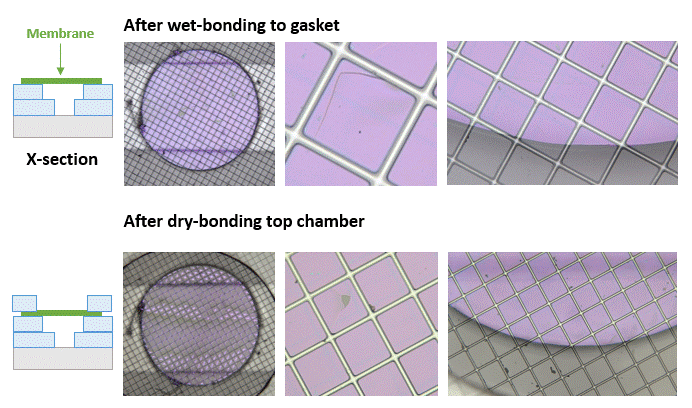
Even though we have made progress, tears still appear. Below is a figure shown more optical micrographs along the process.
Other approaches tested include:
1.- Bonding the gasket to the supported membrane and then releasing in HCl. Wafer bonds to the gasket sometimes or it slides off, causing tears. Etch takes a long time and residual products accumulate on the membrane. We also tried partially etching first but that did not cause any improvement. I believe the membrane pillowing is made worse when partially etching.
2.- Using a silicone bonding agent to “glue” the membrane to a Si frame (broken chip). Very difficult to get an even layer of the glue, hence the membrane wrinkles and breaks.
3.- Using the corona wand to wet bond a released membrane to a Si frame (broken chip). Did not bond, perhaps we could try UV/Ozone chamber instead of wand. This is to avoid bonding to PDMS which can stretch.
We believe the source of tears to be: pillowing during release or manipulation and stretching during bonding. Bonding to a Si frame (or similar) might solve the stretching. Addressing the pillowing seems more complicated.
Stay tuned for more.