Updated Dialysis Research
Microdialysis: Separation of BSA and Cyto C
For the past few months I have been studying how well the 75 nm NPN-O membranes are at clearing cyto c while retaining BSA with and without the presence of PEG coating. Additionally, conductivity tests were performed to determine how well the membrane cleared a small molecule. See the link below for experimental set up and previous results.
Update in Microdialysis Research
Since then, the clearance of cyto c and BSA was found using the following:
![]()
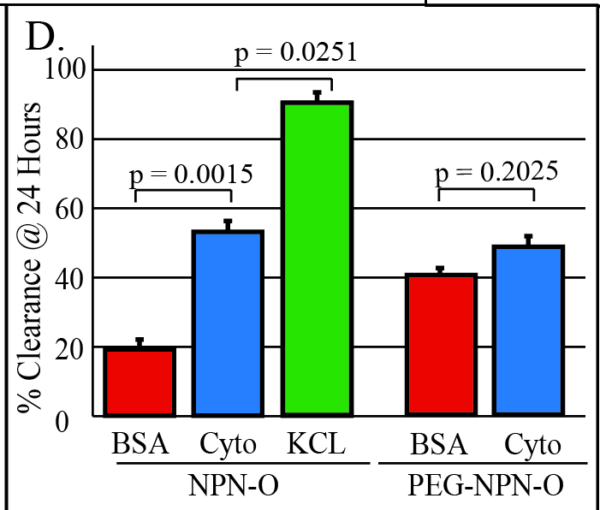
Where L is the fractional loss from the NPN-O PEG/nonPEG and L(inf) is the fractional loss from the nonporous membranes. Figure 1 shows 24 hour clearance of cyto c and BSA for the membranes used. Error bars are standard error of the mean and significance was found using paired and unpaired t tests.
|
Microdialysis Statistics
|
|
|
Variables
|
P value
|
|
BSA-Cyto C NonPEG
|
0.0015
|
|
Cyto C- KCL NonPEG
|
0.0251
|
|
BSA-Cyto C PEG
|
0.2025
|
|
BSA PEG-NonPEG
|
0.977
|
|
Cyto C PEG-NonPEG
|
0.1134
|
Single Pass Dialysis: Urea Clearance in 100% Serum
In addition to the microdialysis, I have been working on completing the single pass data. The original setup and methods can be found in the following link.
Current Dialysis Research [McGrath Lab, December 2017]
Since then, the obtained data was normalized using the following equation:
![]()
From this equation and our data, the following image was formed.
![]()
Statistics performed included paired t tests and an ANOVA to compare clearance of urea between the different time points for each membrane and between the urea clearance of different membranes themselves. Error bars are SEM again. No significant difference was found between the time points or between the PEG and nonPEG. Therefore, we can conclude that the membrane does not foul and there is a steady clearance of urea. Also, PEG had little to no effect on the clearance of urea. Average clearance of urea was found using:
![]()
and with a flow rate of 1uL/min, and area of 1.4 mm^2, and a fractional loss of 0.2, the clearance was 143 mL/min/m^2. Future studies will try to optimize this by increasing the flow rate.