Impedance Spectroscopy to study neutrophil migration induced permeability
So, I have been working with a 4-probe TEER measurement system to record the changes in endothelial permeability during neutrophil extravasation and other biochemical assays such as thrombin treatment and TNF stimulation. 4-probe systems are sensitive because they don’t suffer from the contact impedances and measure only the potential drop across the sample under consideration. See the schematic below that explains these differences between 2- and 4-probe measurements.

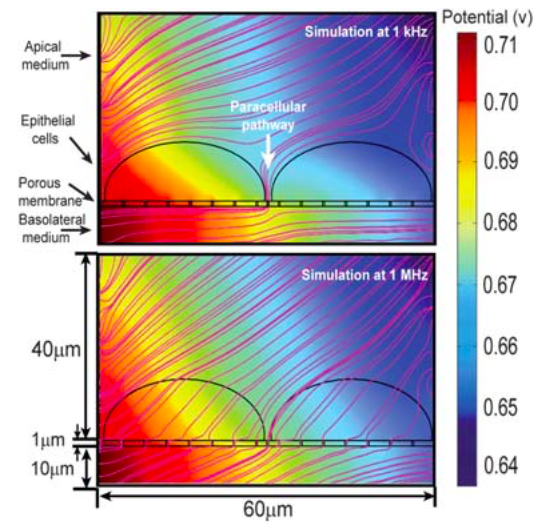
So far I have been using 4-probe measurement using EVOM-VoltOhmeter to measure my TEER changes. Unfortunately, this technique is not the best for my electronic system. This is due to the differences in the nature of silver-silver chloride electrodes (which are made for and compatible with EVOM) vs indium tin oxide electrodes (which I used, and not very compatible with EVOM). EVOM records the current at low frequency of 12.5 Hz, since at low frequency, cell membranes provide very high capacitive impedance, the current is routed through cell junctions (Which is indicative of TEER). See the simulation from somewhere else below.
Since ITO is polarizable, the impedance at 12.5 Hz is very high, and it takes a long time for the capacitors to get charged, and provide a stable measurement. Look at a typical TEER scan below.
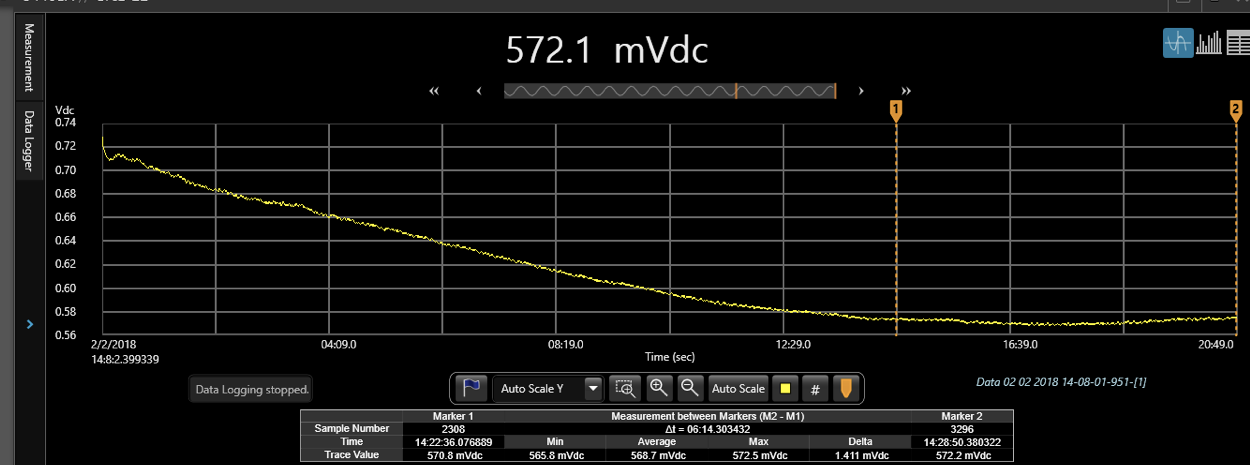
It almost took me ~15 minutes for the scan to stabilize. Also, because of the microfluidic nature of the system, there is much noisiness in the behavior of “stable” scan. This technique is good when time sensitivity is not a factor, for e.g. monitoring cell growth over days, where the TEER changes happen over hours, and 20 minutes doesn’t change anything significantly. Or in the cases, where the changes are so drastic, that the scans drop very sharply and significantly, as in the case of thrombin.
But with neutrophils, the case is different. The changes in permeability are subtle, and also very quick. So I can’t afford to lose 20 minutes to monitor anything big or small change. So I adopted a new technique of impedance spectroscopy, which essentially used 2-probe system, but rather than measuring the impedance at a single frequency, it sweeps across the whole domain from single Hz to mega Hz. These impedance sweeps are useful in delineating different types of information such as membrane capacitance, junctional resistance, bulk resistance etc. It needs intense mathematical modeling though.
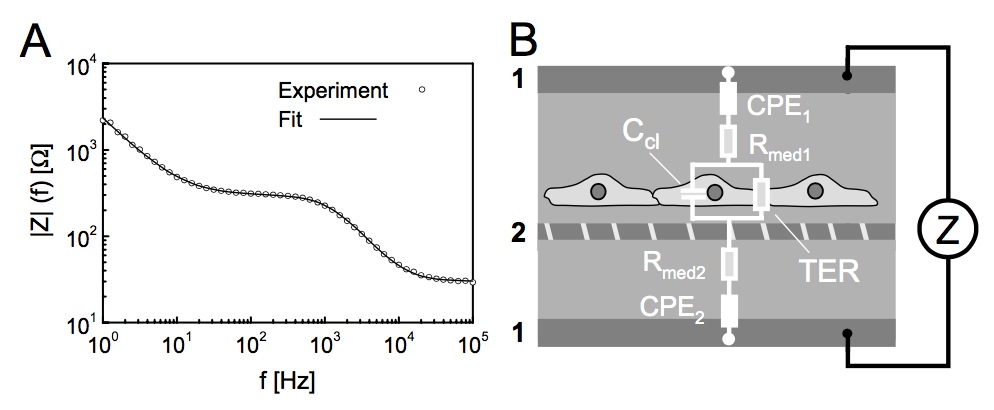
I tried to do that, but it gets too much complicated in trying to fit all the different regions of the frequency (since it’s biphasic or triphasic) as seen from the curves. I also get similar curves. Typical interface looks like this.

And a representative scan looks like this

At low frequency, as explained, the impedances are very high due to capacitive nature of electrodes. It goes down with frequency and plateaus out eventually. The dashed circle on the top left shows the increases in barrier properties since electric current follows cellular junctions as mentioned above. The oval in the middle demonstrates the increases in cell number or occupancy (which is different from barrier). Because there are more cells, there is more lipid bilayer-covered area. At mid-low frequencies, current goes through cell membrane comparably as cell junctions: hence more impedance as the cell number goes up. At very high frequencies, the capacitances are all shorted out and hence the impedance is basically indicative of the bulk resistance i.e. the media and contact impedances, which are constant and don’t change even if cells grow or die (hence both curves meet at a singular point). By monitoring these scans (each of which takes around 6-7 minutes), one can estimate the nature of cell growth empirically without actually modeling the math equations behind it.
Back to biology: I am using this method now to understand the effects of neutrophil (PMN) transmigration on endothelial permeability. I grow HUVECs under static for 24 hours and then under 10 dynes for another day. Then I introduce PMN in the concentration of 10 million/ml in the apical side, and 10 nM fMLP on the basal side to activate PMN. I monitor the TEER for 30 minutes. I reduce sampling frequencies so that I can finish each scan in 1 minute and can, thus, record 30 scans in 30 minutes. Then I choose the impedance at 12.5 Hz (as used by EVOM) and plot the changes in impedance values at that frequency over time. This will indicate the changes in barrier properties over time as PMN transmigrate. So far I hav got n=3. I also tested for the effects of (or lack thereof) fMLP addition in the absence of neutrophils to ensure that neutrophil-migration alone can cause drop in impedance. The data obtained so far:

The dashed blue lines show the effect of fMLP alone, while the red lines show the effect of PMN+fMLP together. Averaging out the 3 red scans, we can claim that there is about 50% drop in half hour. Next, I am going to get few more data points and bolster the statistics. Afterwards, I will test my hypothesis on reducing endothelial permeability by using anti-cd29 blocking antibody. Stay tuned!
This is cool stuff – have you tried locking in on a constant 12.5Hz oscillation with a phase-locked loop (or post-analysis equivalent)? This would allow you to trade off the temporal window for SNR where necessary and maybe observe any transient shunts created as the neutrophils translocate (or the epithelia shift aside).