Characterizing Tangential Flow Filtration with Ultra-thin Membranes: A Preliminary Look
Introduction:
Over the past few weeks I’ve begun working on a project that deals specifically with characterizing tangential flow filtration with our labs ultra-thin membranes. Essentially, I’m working on understanding the advantages our membranes have over conventional/thicker ones by looking at characteristics such as transmembrane pressure, fouling, and flux.
Our working hypothesis is that our ultra-thin membranes will exhibit non-fouling performance over specific parameters (flow rates and serum concentration) compared to conventional ones.
This is due in part to a phenomenon known as critical flux; there exists a flux below which a membrane allows materials to pass through it without fouling. Note that this flux is generated by a specific supply flow rate (Qs) and ultra-filtration rate (Qu).
Here’s an image from Dr. McGrath’s grant proposal that helps illustrate this. The behavior we expect is noted in panel “A” while conventional membranes tend to behave like the image in panel “B”. A lower transmembrane pressure (resultant from a thinner membrane) is expected to keep materials flowing through a membrane for higher Qu.

With this in mind, we propose (as a specific hypothesis) that the transition to a clogged state in our ultra-thin membranes (like panel B above) will occur at a higher Qu versus a traditional membrane under controlled parameters.
Device Design:
A standard two channel/single slot design is being utilized in order test our assumptions. I’ve provided a diagram detailing basic flow paths and the gasket layers as they appear in the device. Note that the bottom inlet is clamped off while the top outlet is exposed to atmosphere.

The types of chips used will be Nanoporous membranes, TE chips, and control (non-porous membranes). The fluid used in this experiment will be bovine serum albumin (BSA) suspended in PBS.
Syringe pumps are being used in order to deliver precise supply and ultrafiltration rates.
The “Parametric Sweep”:
In order to build a predictive model, we’ll be modulating supply rate (1, 4, 10, 30, 50, 100 μl/min) and bovine serum albumin concentration (0.1, 0.5, 1, 2, 5 mg/ml). For each combination of conditions the ultrafiltration rate will be increased in intervals of 10% (compared to supply rate) until a rate is identified at which transmembrane pressure fails to stabilize. We’ll call this Q*u and will subsequently define critical flux as J*=Q*u /A (where A= area of the active membrane surface). The following is an image from Dr. McGrath’s proposal indicating what data may look like:

Preliminary Data:
First off is data from 1mg/ml serum at Qs=30 μl/min and Qu=10 μl/min. I’ve plotted volume filtered through the membrane and time on the x-axis.
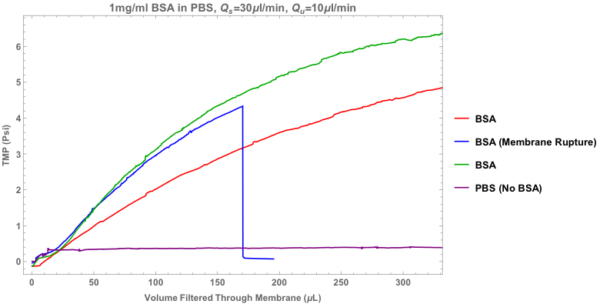

Note that despite similar initial starting conditions, these trials have a decent spread with respect to change in pressure over time. I chose to include the blue data set (membrane rupture) in order to show an example of data that exists within the bounds of the results of previous trials.
Next is data from 5mg/ml serum at Qs=30 μl/min and Qu=10 μl/min.

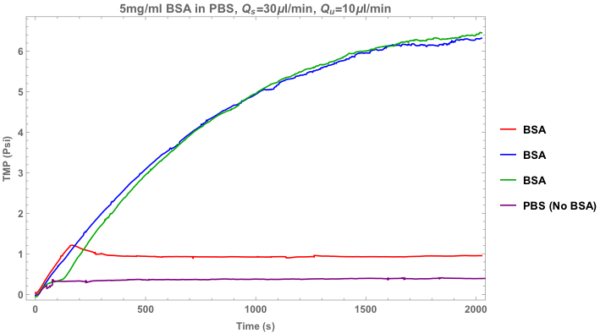
These trials are much closer together time-wise and interestingly one of the trials (red) resulted in a stable pressure situation. Further examination with a microscope indicated that there were no microscopic defects in the membrane and overall the chip appeared intact, implying that this was not a defect. It is possible that this is the result of a stable protein cake layer.
Future Directions:
Further data will be obtained at the 0.1 and 1.0 mg/ml concentrations at the aforementioned supply and ultrafiltration rates.