Exosome labelling Problems: PKH Nanoparticles
Hello Everyone,
I’ve been working on exosome labelling and trying to characterize it by NTA. So we read a paper published a month ago, explaining the presence of PKH nanoparticles as false positive results in internalization studies. They studied four different staining protocols and showed the presence of these nanoparticles regardless of the staining protocol. Here are the take home points of this paper:
So when you buy the PKH kit, it comes with a buffer called Diluent C. Unfortunately we don’t know about the composition of the Diluent C, and i even called Sigma and asked them but apparently it’s a secret!!!. Tom and i found the composition from another vendor (New England Biolabs) and for a different application (Enzyme digestion):250 mM NaCl , 10 mM Tris-HCl , 1 mM DTT , 0.1 mM EDTA , 0.15% Triton® X-100 , 200 μg/ml BSA , 50% Glycerol , pH 7.4@25°C .
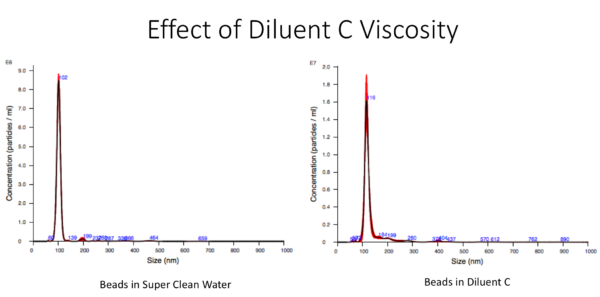
So having glycerol in diluent C made us curious about the viscosity of this buffer which would directly effect the result with NTA (Brownian motion and the size of the particles). So in order to evaluate this factor on the size distribution of particles measured with NTA, we used a known size of beads (100nm) and diluted them in DI water and Diluent C and measured the size of particles. From this result, it seems that the viscosity of diluent C is not significantly different that DI water even though the size peak shifted almost 15 % from 100 to 115 nm. So from this point, all of the samples with Diluent C were measured considering 15 % shift and were normalized with this shift.
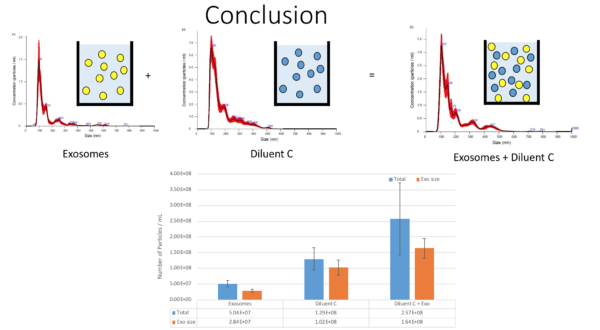
So the recommended protocol for exosome labelling is adding 4 uL of PKH to 1 mL of diluent C and then adding 100 uL of Exosome sample. So in order to test the presence of particles in the same size range as exosomes, different sets of samples were designed and tested. First, we started with only diluent C and surprisingly, Diluent C alone has 2.5E8/mL particles with 1.6E8/mL in the same size range as exosomes. Then we checked the concentration of exosomes which was like we expected. The first mixture sample was diluent C + Exosomes and you can see the result in the following figure;
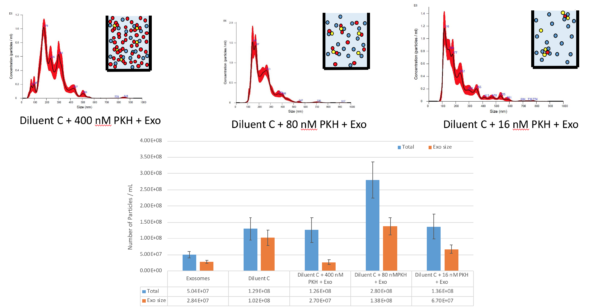
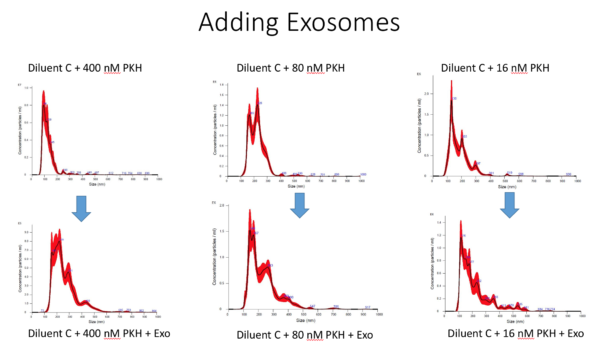
For the next step, we added 4 uL of PKH to 1 mL of Diluent C and then we measured the sample. 3 different dilution of PKH samples were tested 1X, 5X, 25X.

This result suggests that 4 uL of PKH has a high concentration of exosome size particles as well, which also decreases as we dilute the sample more and more. But since Diluent C already has exosome size particles, this dilution is not linear. Even though the concentration of exosome size particle in 25 X sample is lower than diluent C alone, which is most likely suggesting that binding happens between the exosome size particles in Diluent C and PKH leading to decreasing in the concentration.
The next step was to add exosomes and study the concentration of particles; again 3 different dilution samples of PKH were tested with exosomes and the result shows that:
the concentration of the 1X sample is not equal to the sum of the Diluent C, PKH and Exosomes, suggesting that these particles are binding to each other forming aggregates and larger particles as you can see in the following figure. When we dilute the sample 5X, we see higher concentration of particles suggesting that less binding is happening and individual particles from different samples (Exosome, PKH and Diluent C) are being detected. But when we dilute the sample 25X, the concentration again drops suggesting that the dominant sample is diluent C and not PKH any more.
Comparing the different dilution samples with and without exosomes can be seen in the following figure:
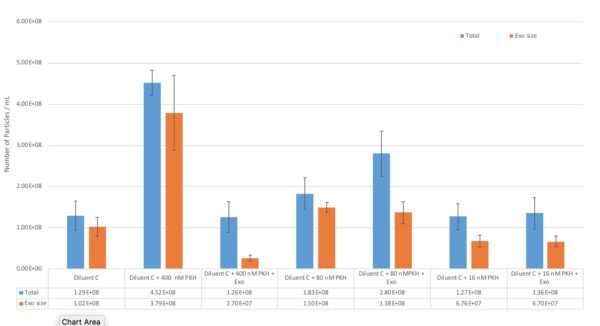
In summary, all the results can be seen in this table:

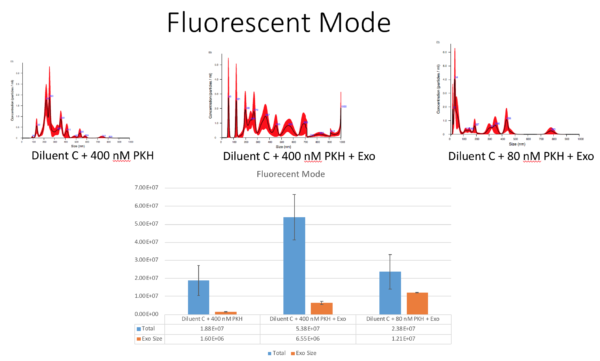
Furthermore, we checked the particles size and concentration with NTA on the fluorescent mode; This data might not be the best result because the signal from our labelled particles was not that strong, but it was still important to measure them. So the following figure shows the concentration and size of 3 different samples including; 1. Diluent C + 1X PKH 2. Diluent C + 1X PKH + Exo 3. Diluent C + 5X PKH + Exo. Even though in flourescent mode, the signal to noise ratio was not that strong, so i am not 100% confident with this data:
So Tom and i discussed the results and Here are my plans for these experiments:
- Increase the concentration of exosomes (with same PKH concentration and higher PKH concentration)
- Fluorescent Microscopy (to show the larger aggregates)
- TEM
- Evaluating other dyes (RNA Select)