hiPSC Differentiation to Endothelial Cell Culture Method, Brain Microvascular Endothelial Cells (EECM-BMEC-like cells), Round 1
Introduction
Breakdown of the blood-brain barrier (BBB) is one of the earliest signs of sepsis and is linked with long-term cognitive impairment. As animal models poorly recapitulate human sepsis, alternative approaches are direly needed to understand sepsis-associated brain injury and develop strategies that protect against cognitive decline. To fill this gap, we are developing a microfluidic model of the human blood-brain barrier (µSiM-hBBB) to elucidate mechanisms of BBB breakdown during sepsis. The first version of the µSiM-hBBB will be developed using human induced pluripotent stem cells (hiPSC) to derive two cellular components of the neurovascular unit: brain microvascular endothelial cells (BMECs) and pericytes.
Over the last decade or so, several protocols have been developed to differentiate brain endothelial cells from hiPSCs, however, each protocol has its imperfections and the method used must be appropriate for the study at hand. During sepsis, monocyte infiltration into the brain is thought to be the causative agent of long-term brain dysfunction, based on murine studies. As such, we will be using a newly published protocol that differentiates hiPSCs into BMEC-like cells using an endothelial cell culture method (EECM-BMEC-like cells) (Nishihara et al., FASEB, 2020). The cells show tight junction maturation and good barrier properties, but most importantly, they express key proinflammatory cell surface adhesion molecules necessary for immune cell migration.
The method differentiates hiPSCs into endothelial progenitor cells (EPC, CD31+) and then utilizes selective passaging to purify and mature EECM-BMEC-like cells. This post summarizes my first attempt at replicating this protocol in our lab.
Methods
see Nishihara et al., FASEB, 2020 for full methodology
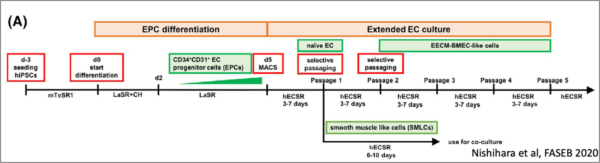
Thaw Cells (WiCell iPSC (IMR90)-4)
- Thaw iPSCs briefly in a 37°C waterbath, swirling gently.
- Transfer gently to 15 mL conical and add 11 mL mTeSR1 (StemCell Technologies) with 10 µM ROCK inhibitor (Y-27632, Millipore) dropwise to cells, gently swirling as media is added.
- Pellet cells by centrifugation at 200 x g for 5 min and resuspend in 1 mL mTeSR1 + 10 µM ROCK inhibitor.
- Add 500 µl/ well cell suspension to 1.5 mL in Matrigel-coated 6 well dish. Incubate at 37°C, 5% CO2.
- Feed cells with mTeSR1 daily. Pass when cells reach 80-90% confluency. Maintain about 2 weeks prior to seeding.
EPC Differentiation
D-3 to D-1
- Singularize cells with accutase. Add to 0.5 ml mTeSR1 each well and pool in conical.
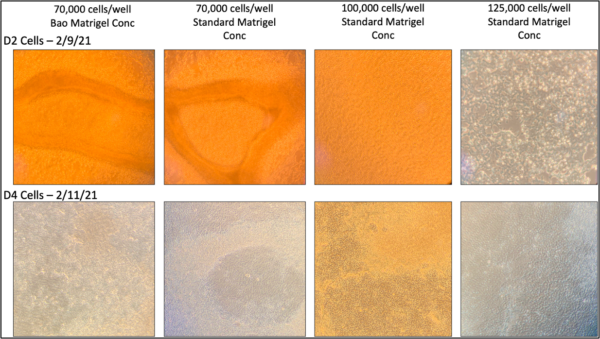
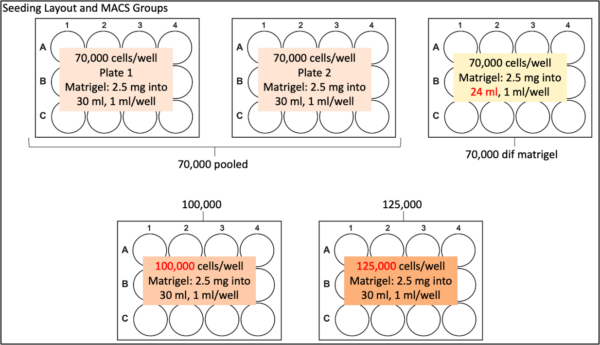
- Pellet cells by centrifugation at 200 x g for 5 min and resuspend in mTeSR1 + 5 µM ROCK inhibitor to the desired densities (optimizing density this round). Add cells to Matrigel-coated 12 well plates.
- 70,000 cells/well
- 100,000 cells/well
- 125,000 cells/well
- Incubate at 37°C, 5% CO2 for 24 hours, then feed daily with mTeSR1.
D0-D1
- Switch medium to LaSR basal medium (Advanced DMEM/F12 with 2.5 mmol/L GlutaMAX and 60 μg/mL L-ascorbic acid) supplemented with 8 μM CHIR99021. Feed with 2 ml/well daily.
D2-4
- Feed cells daily with LaSR basal medium (no CHIR99021).
Purification of CD31+ EPC
D5
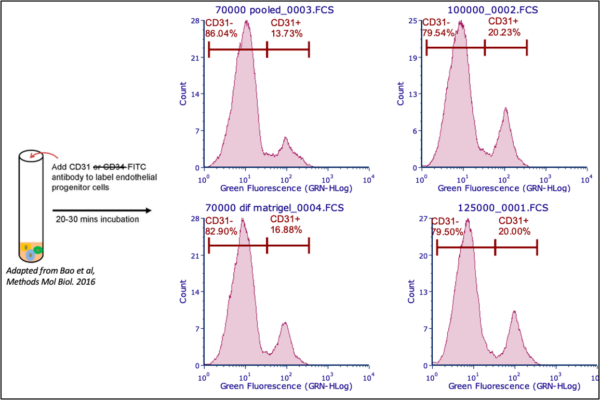
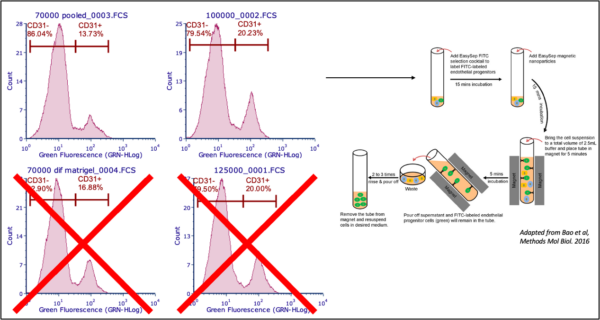
- Sort CD31+ EPC via magnetic-activated cell sorting using FITC-conjugated human CD31 antibody (Miltenyi Biotec, clone AC128) and EasySep Human FITC Positive Selection Kit II (STEMCELL Technologies) with an EasySep Magnet. Prior to sorting, analyze by flow cytometry to determine differentiation efficiency. If the population is <8% CD31+, do not continue.
- Only sorted and seeded 70,000 and 100,000 cells/well platess
- After sorting, seed purified EPCs onto collagen IV (Sigma, 10 μg/mL)-coated 6 well culture plates hECSR medium supplemented with 5 μM ROCK inhibitor Y-27632 at 20-30,000/well
- hECSR medium: hESFM (Thermo Fisher Scientific) supplemented with 1X B27 (Gibco) and 20 ng/mL bFGF (Gibco)
- 70,000 cells/well plate – seed at 2 x 10⁵ cells/well (cell/SA kept consistent)
- 100,000 cells/well plate – seed at 3 x 10⁵ cells/well (cell/SA kept consistent)
EECM-BMEC-like Cell Differentiation (with Naïve EC transition)
D6 on…
- The following day, switch medium to switch medium to hECSR medium without ROCK inhibitor.
- Feed cells every 2-3 days. Pass when 100% confluent.
Passage 1 (Naïve ECs)
- Selectively passage naïve endothelial cells using Accutase.
- Carefully observe cells under an inverted microscope. Once endothelial cells (but not non-ECs) start to become roundish, physically detach cells by tapping the 6-well plate.
- Collect naïve endothelial cells in a conical tube containing 4 mL of hESFM and centrifuge at 200 x g, 5 min.
- Resuspend and seed onto collagen IV (10 μg/mL)-coated culture plates at a density of 2 x 10⁵ cells/well) in hECSR medium
Passage 2-5 (EECM-BMEC-like Cells)
- Continue to feed cells every 2-3 days. Pass when 100% confluent using the same protocol for passage 1. Once the population is pure ECs, selective passaging is no longer necessary.
- For analysis, seed cells onto collagen IV (400 μg/mL)/fibronectin (Gibco, 100µg/ml)-coated culture plates at a density of 100,000/cm2 in hECSR medium.
Analysis
TEER/Permeability
- At each passage, seed a subset of cells into 6.5mm diameter, 0.4 µm PC Transwell filters. Culture for 6 days, taking TEER measurements daily (EndOhm chamber using EVOM2 system).
- On day 6, assay permeability using sodium fluorescein (Sigma). Add 10 µM NaFl to top chamber and sample from bottom chamber every 15 minutes for 1 hour. At the 60 min time point, take an additional sample from the top chamber for clearance calculation.
- Measure fluorescence intensity on TECAN (485 nm excitation/530 nm emission).
- Correct signal by removing background and accounting for signal loss from sampling bottom chamber.
- Calculate clearance using: Clearance volume = (VB*( SB,t)) / (ST,60 min), where VB is the volume of bottom chamber; SB,t is the corrected signal of bottom chamber at time, t; ST,60 min is the signal of top chamber at 60 minutes.
- Calculate the linear slope of clearance volume vs. time using Excel using linear regression for both the culture (mc) and the blank filter (mf).
- Calculate sodium fluorescein permeability using the following formula: 1/Pe = 1/(mc)–1/(mf). Pe (cm/min) = [(1/(1/Pe)) / 1000]/Area.
- Fix and stain for ZO-1.
ICC on Junctional Markers
- At passage 3, seed a subset of cells into a 96 well plate. Culture for 3 days, then fix and stain for VE-cadherin (R&D Systems), PECAM-1 (Thermo, Cat.# PA5-32321), Claudin-5 (Thermo, Cat.# 35-2500), Occludin (Thermo, Cat.# 35-1500), and ZO-1 (Thermo, Cat.# 40-2200).
Cytokine Stimulation and Flow Cytometry Analysis
- At passage 4, seed a subset of cells into 12mm diameter, 0.4 µm PC Transwell filters and culture for 5 days. At passage 5, seed a subset of cells into a 24 well plate and culture for 1 day.
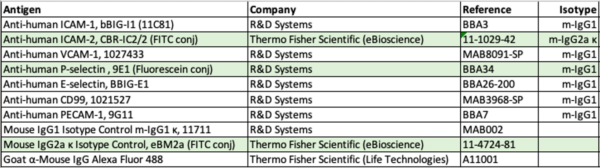
- Stimulate a subset of wells with 1 ng/mL of recombinant human TNF-α (R&D Systems) and 20 IU/mL recombinant human IFN-γ (R&D Systems) for 16 hours.
- Stimulated and non-stimulated control cells were gently detached with Accutase, washed, and resuspended in FACS-buffer (DPBS (1X), 2.5% FBS, 0.1% NaN3).
- 1 x 10⁵ cells/well were transferred to a 96-well plate and incubated 20 minutes on ice with the unconjugated antibodies, respective isotype controls, or FACS buffer (for conjugated antibodies and unstained control). Cells were washed twice with DPBS and incubated 20 minutes on ice with the fluorochrome-conjugated antibodies or FACS buffer (for unstained control).
- After staining, cells were washed twice with DPBS and measured with a Guava EasyCyte Flow Cytometer. Data were analyzed using FCS7 Express software.
Results
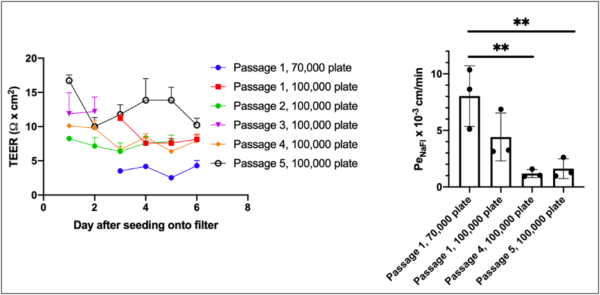
High TEER was not achieved. Permeability improved from P1 to P4 and P5, however, the permeability values are still above the published values obtained for IMR90-4 (~0.7 x 103 cm/min).
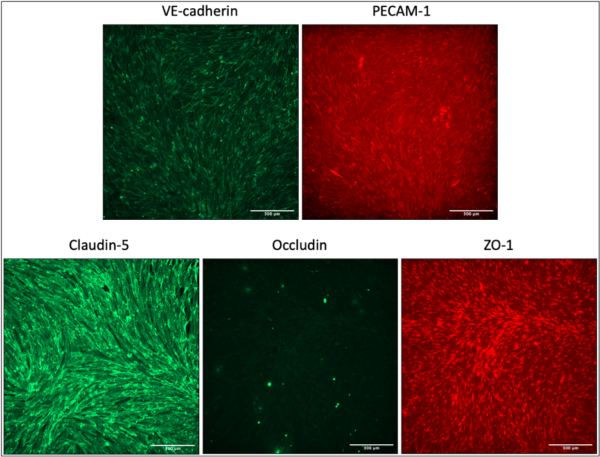
Cells express VE-cadherin and claudin-5 and its junctions, whereas PECAM-1 is more dispersed. ZO-1 was found both at the nuclei and junctions, which may be due to inefficient time for maturation. The cells lacked occludin staining.
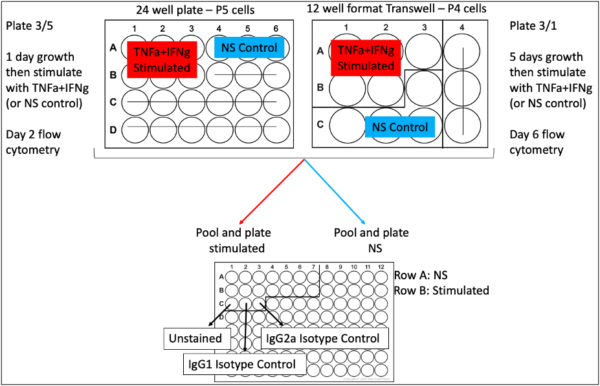
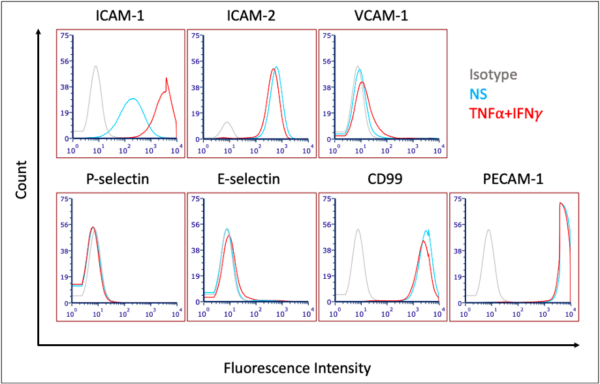
Similar to published results, ICAM-1 expression was upregulated upon cytokine stimulation, whereas ICAM-1, CD99, and PECAM-1 were expressed in both stimulated and NS cells. VCAM-1 was not expressed by these cells, which is consistent with published EECM-BMEC-like cell monoculture results. Interestingly, our cells lacking expression of P-selectin and E-selectin.
Conclusions
This first round of EECM-BMEC-like cell differentiation shows promise for bringing this protocol to our lab, although there are some aspects that need improvement.
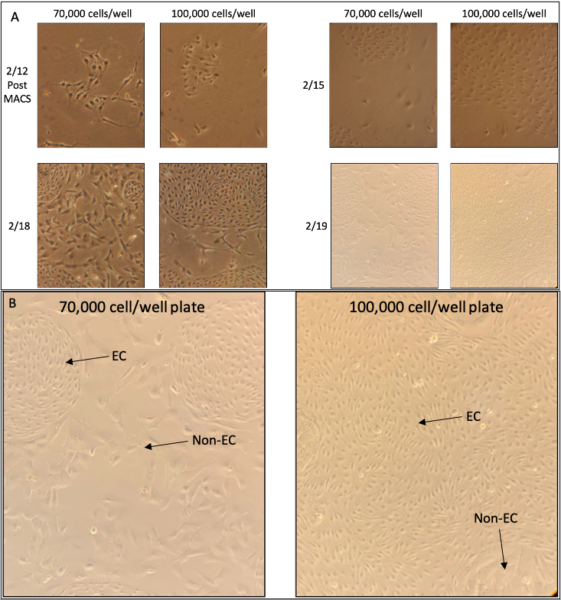
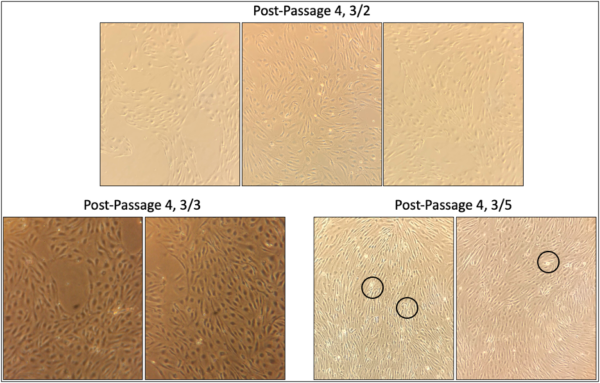
We were able to optimize initial seeding density to 100,000 cells/well, which had ~20% cells CD31+. This plate had greater differentiation to naïve ECs following MACS compared to the 70,000 cell/well plate, and it showed higher TEER and trended toward lower permeability (not significant). In the following passages, as the cells matured to EECM-BMEC-like cells, the cells demonstrated elongated morphology as they reached confluency, with minimal (but some) non-EC contamination after passage 4.
While we did not achieve high TEER, our main output for barrier tightness is NaFl permeability. While we did not reach the permeability values published for IMR90-4 (~0.7 x 103 cm/min), we did see significant reduction of permeability in our passage 4 and passage 5 cells, compared to passage 1, achieving Pe of ~1 x 103 cm/min.
Our cells expressed key junctional molecules, VE-cadherin, claudin-5, ZO-1, and PECAM-1, however, there was no occludin expression as analyzed by ICC. The location of our ZO-1 staining indicates the cells needed more time to mature their junctions (more than 3 days). In the future, we will stain on the cell that we analyzed for TEER and permeability, and culture longer.
For proinflammatory cytokine stimulation, overall the cells expressed cell surface markers necessary for adhesion. However, the lack of selectins is troubling. I did not use the same antibodies as Nishihara et al, so I am checking the antibodies first.
The plan is to repeat the experiment with our optimized seeding density. Since I am more familiar with the techniques, we will see if we get improved barrier function and eliminate non-EC contamination. If we still lack selectin expression in the second round of differentiation, we will modify the protocol as needed.