New Gold Ladder
UPDATED: More sizing characterization (see chart and figure below).
We recently purchased our own gold ladder, and today I’ve done some of the initial characterization. Particles come in 5, 10, 15, 20, 30, and 40nm. Here are the absorbance scans in both water and 10mM KCl:
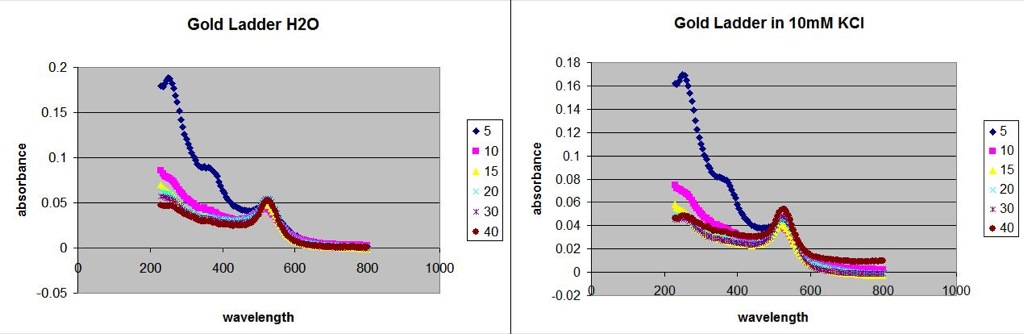
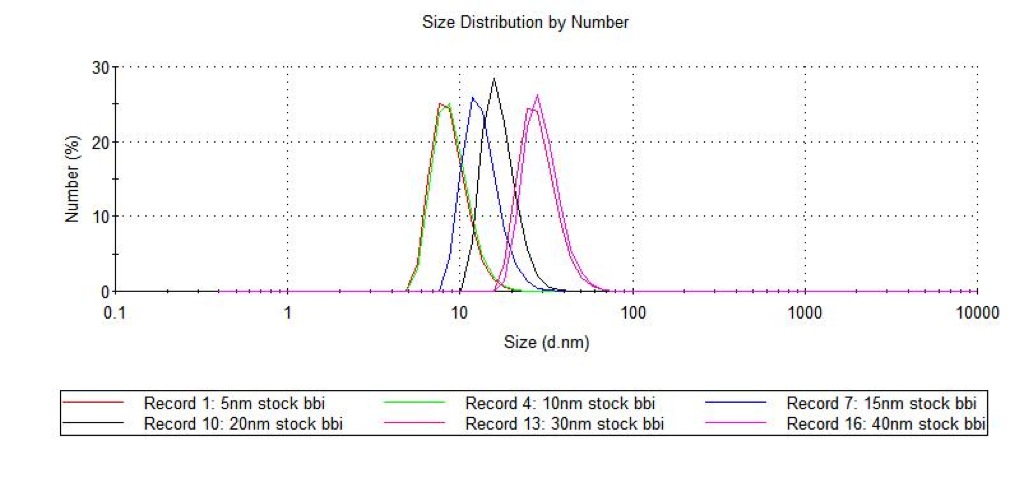
The scans look similar, so none of these particles are aggregating in 10mM KCl. The 525nm peak is the gold signature in all of these scans. Here’s the DLS sizing data in H2O:
| Manufacturer’s Size | DLS H2O | DLS 10mM KCl | BSA-Au 100mM KCl |
| 5 | 8.2 | 8.0 | 12.7 |
| 10 | 9.4 | 8.8 | 14.9 |
| 15 | 13.2 | 10.8 | 20.6 |
| 20 | 17.2 | 13.9 | 20.6 |
| 30 | 28.8 | 21.0 | 29.9 |
| 40 | 30.7 | 37.4 | 37.4 |
Here is a figure with this sizing data:
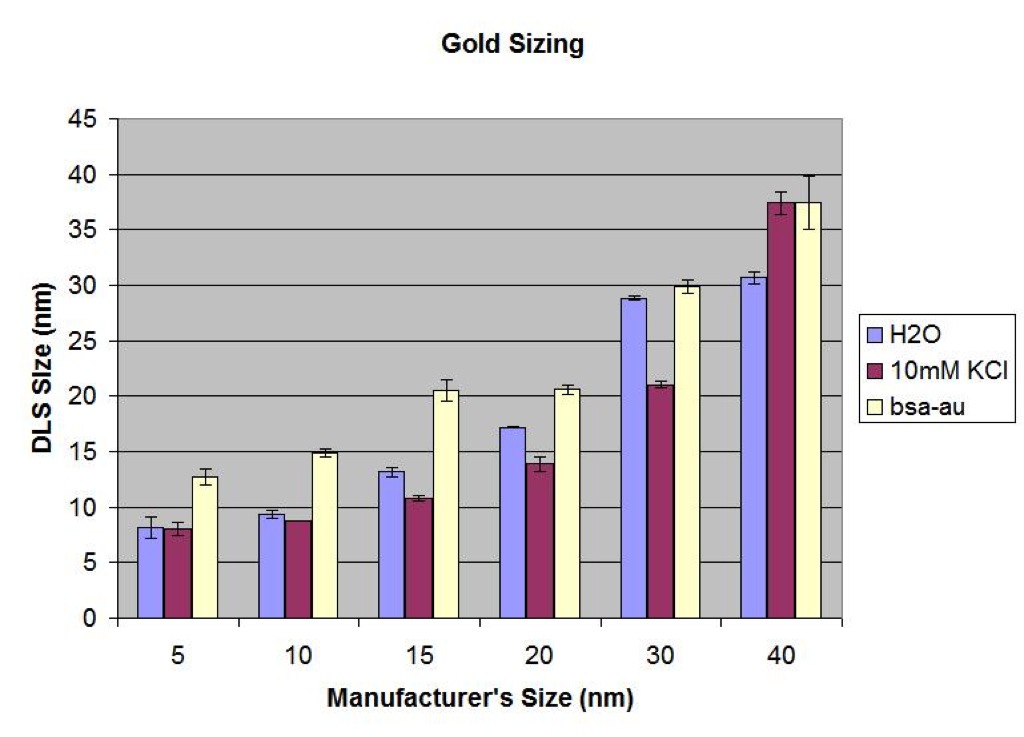
I’m not sure why there’s a reduction with 10mM KCl. Addition of BSA in most cases only raises the size by 5nm.
Gold in 100mM KCl will aggregate. This can be seen by eye as a color change to purple or total loss of coloration as the aggregates fall out of solution. By adding BSA to the gold, we can stabilize it in high salts. This image shows the aggregating and bsa-protected gold:
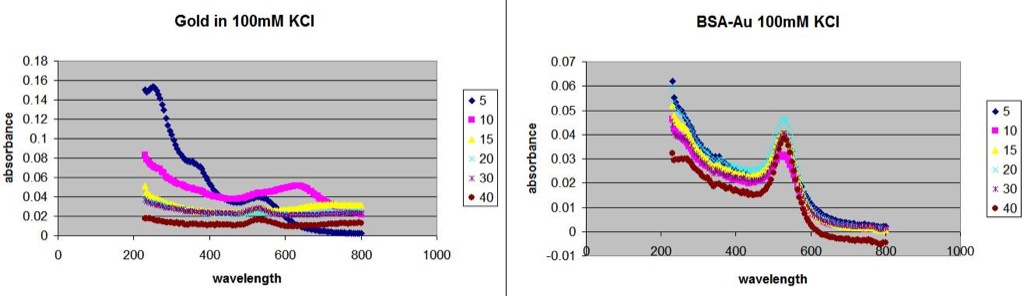
Sizes of particles in 100mM were all above 100nm except for the 5nm sample which was only partially aggregated in 100mM KCl.