Coomassie Linear Range
In this gel I evaluated the linear range of coomassie brilliant blue.
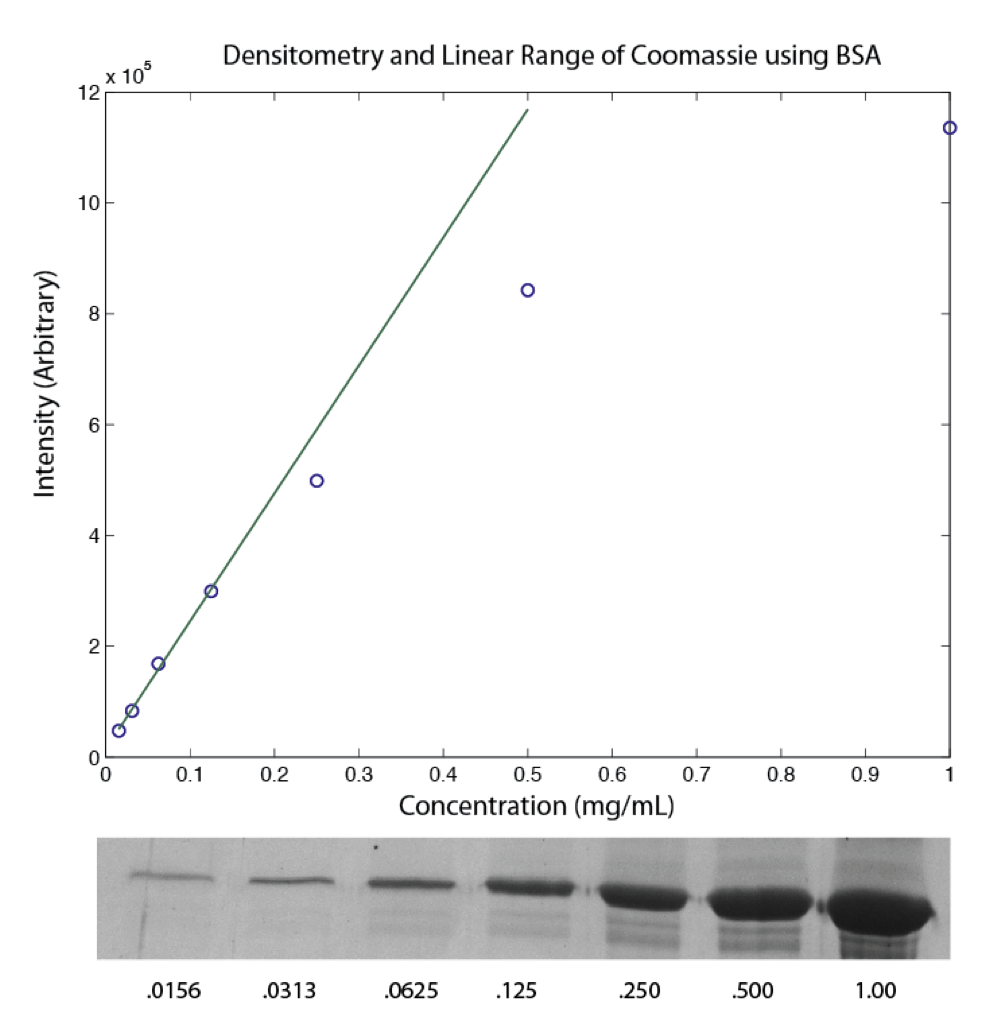
From this test it looks like things are linear from .0156 to .125mg/mL. My guess is that the protein ladder bands in the previous experiment fall within the range.
I used the Bradford assay to find the total concentration of the stock protein ladder. I used BSA to form a standard curve and used this curve to find the concentration of the protein ladder.
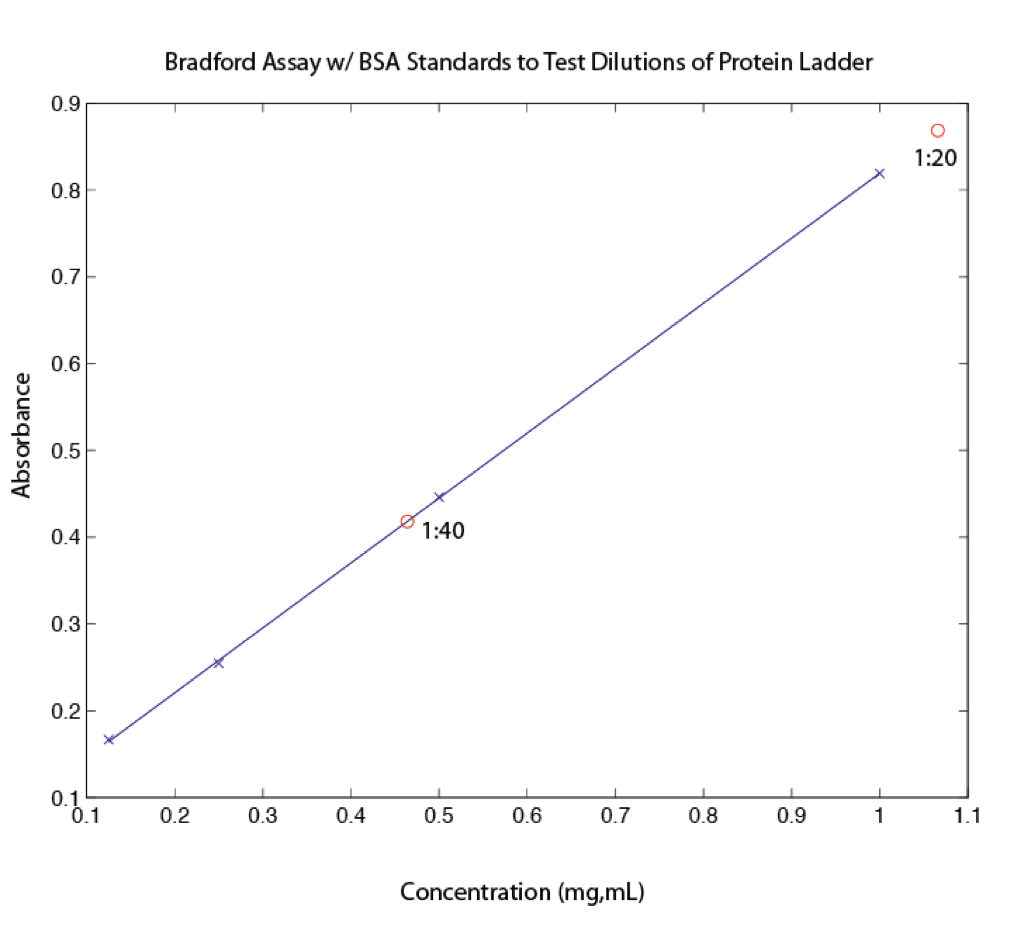
From this assay the protein ladder has a concentration of 19.9 mg/mL. In my separation gels, the ladder is diluted 1:30 or higher depending on the amount of equilibration. Start solutions will have a 1:30 dilution. This means the total concentration will be somewhere around .67 mg/mL. There are about 10 different proteins that make up these ladders, so the concentration of each band will be much lower than the total and probably within the linear range.
In the following experiments, if we are worried about finding the concentrations of the bands, I can run a series of BSA standards on the same gel. This would allow the use of a concentration rather than arbitrary intensity in the plots.