Bacterial Inflammatory Stimulation of the μSiM-BBB Model
Introduction
Sepsis refers to an uncontrolled systemic inflammatory response which can result from bacterial blood infections. We have long been interested in developing a sepsis model using the μSiM-BBB platform because the neuroinflammation stemming from sepsis can cause severe BBB disruption. For the majority of our stimulation experiments we have relied on cytomix, a cocktail consisting of three human pro-inflammatory cytokines (TNF-α, IL-1β, and IFN‐γ). This is excellent for modeling the host cytokine storm that is believed to be the major contributor to inflammation during sepsis. However, we have only recently started focusing on the impact of bacterial-derived inflammatory stimuli. We sought to characterize changes in endothelial cell activation, permeability, and tight junction protein expression after exposure to lipopolysaccharide (LPS). Furthermore, we were curious if pericytes might offer a protective effect against LPS. Finally, we have begun exploring how other bacterial factors, namely bacterial extracellular vesicles (bEVs), might cause profound inflammatory effects.
Methods
For 96-well plate experiments, IMR90 iPSC-derived extended endothelial culture method brain endothelial cell-like cells (BMECs) [1] or human umbilical vein endothelial cells (HUVECs) were seeded at ~40,000 cells/cm2. For μSiM experiments, 15,000-17,500 BMECs were seeded above NPSN membranes and 6,000 IMR90 iPSC-derived brain pericyte-like cells (BPLCs) [2] were seeded on the underside of the membranes. Cultures were generally maintained for 6 days prior to experimentation. Cells were treated with varying doses of LPS or bEVs for 16 – 18 h unless otherwise specified. Permeability was assessed using the μSiM sampling method. Briefly, 150 μg/ml lucifer yellow dye was added to the top well and allowed to diffuse for 60 min. Media was sampled from the lower channel and its fluorescence intensity was compared to a lucifer yellow standard ladder to determine the concentration of dye that had diffused across the membrane. For endothelial activation studies, cells were stained for ICAM-1. Claudin-5 was stained to examine tight junction protein breakdown.
Results and Discussion
We first assayed the necessity of LPS-binding protein (LBP), which is present in blood and forms a complex with LPS that facilitates endothelial cell uptake of LPS [3]. BMECs in a 96-well plate were treated with 1 μg/ml LPS, 1 μg/ml LBP, or both LPS and LBP together (fig. 1). 500 pg/ml cytomix (167 pg/ml of each component) was used as a positive control for endothelial activation. LBP by itself did not lead to a substantial increase in ICAM-1 signal over the unstimulated condition. LPS by itself did increase the average fluorescence signal, but this appeared to simply be high background signal based on the lack of clearly defined ICAM-1-positive cell bodies in the images. Only when LPS and LBP were both present did there appear to be ICAM-1 activation on the BMECs.

LBP is present in serum. Partially due to the limited availability of our recombinant LBP and partially out of curiosity as to how the other protein components of serum might interact with LPS, we decided to assess the effect of 2% FBS on BMECs. Neither 2% FBS nor 1 – 10 μg/ml LBP resulted in apparent ICAM-1 activation on BMECs in the absence of LPS (fig. 2A,B). 2% FBS was able to facilitate BMEC ICAM-1 activation in the presence of LPS, particularly at 10 and 100 ng/ml LPS (fig. 2C,D). We therefore decided to continue using media supplemented with 2% FBS for stimulation experiments. It is important to note that FBS is not a typical component of the BMEC media. This is because the BMEC media supplements are highly controlled to support the BMEC differentiation, and the components of FBS can vary widely from lot-to-lot. We have not performed a complete recharacterization of the BMECs to determine whether or not the FBS is altering their phenotype, but we have paid special attention to the endothelial permeability and tight junction structures to confirm that these at least still appear typical for the BMECs (figs. 4C,5).

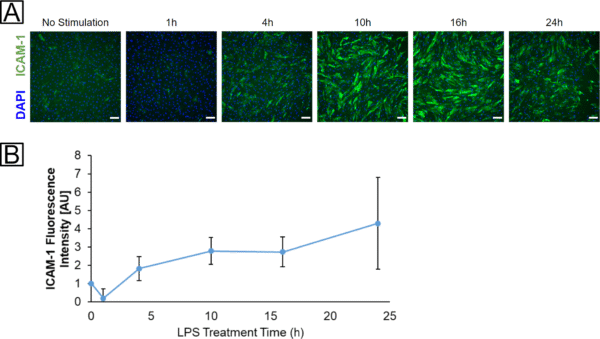
We somewhat arbitrarily chose a 16 – 18 timeframe for our stimulation period, but decided to investigate if this was reasonable or if we were missing peak ICAM-1 activation. BMECs in a 96-well plate were treated with 100 ng/ml LPS for 0, 1, 4, 10, 16, or 24 h (fig. 3). ICAM-1 labeling intensity seemed to plateau after 10 h, and remained high at 16 h. At 24 h, the mean intensity of our ICAM-1 stain remained high, but our results were much more variable. Due to these results (and because there is admittedly a convenience factor to overnight treatment), we chose to stick with a ~16 h treatment period.
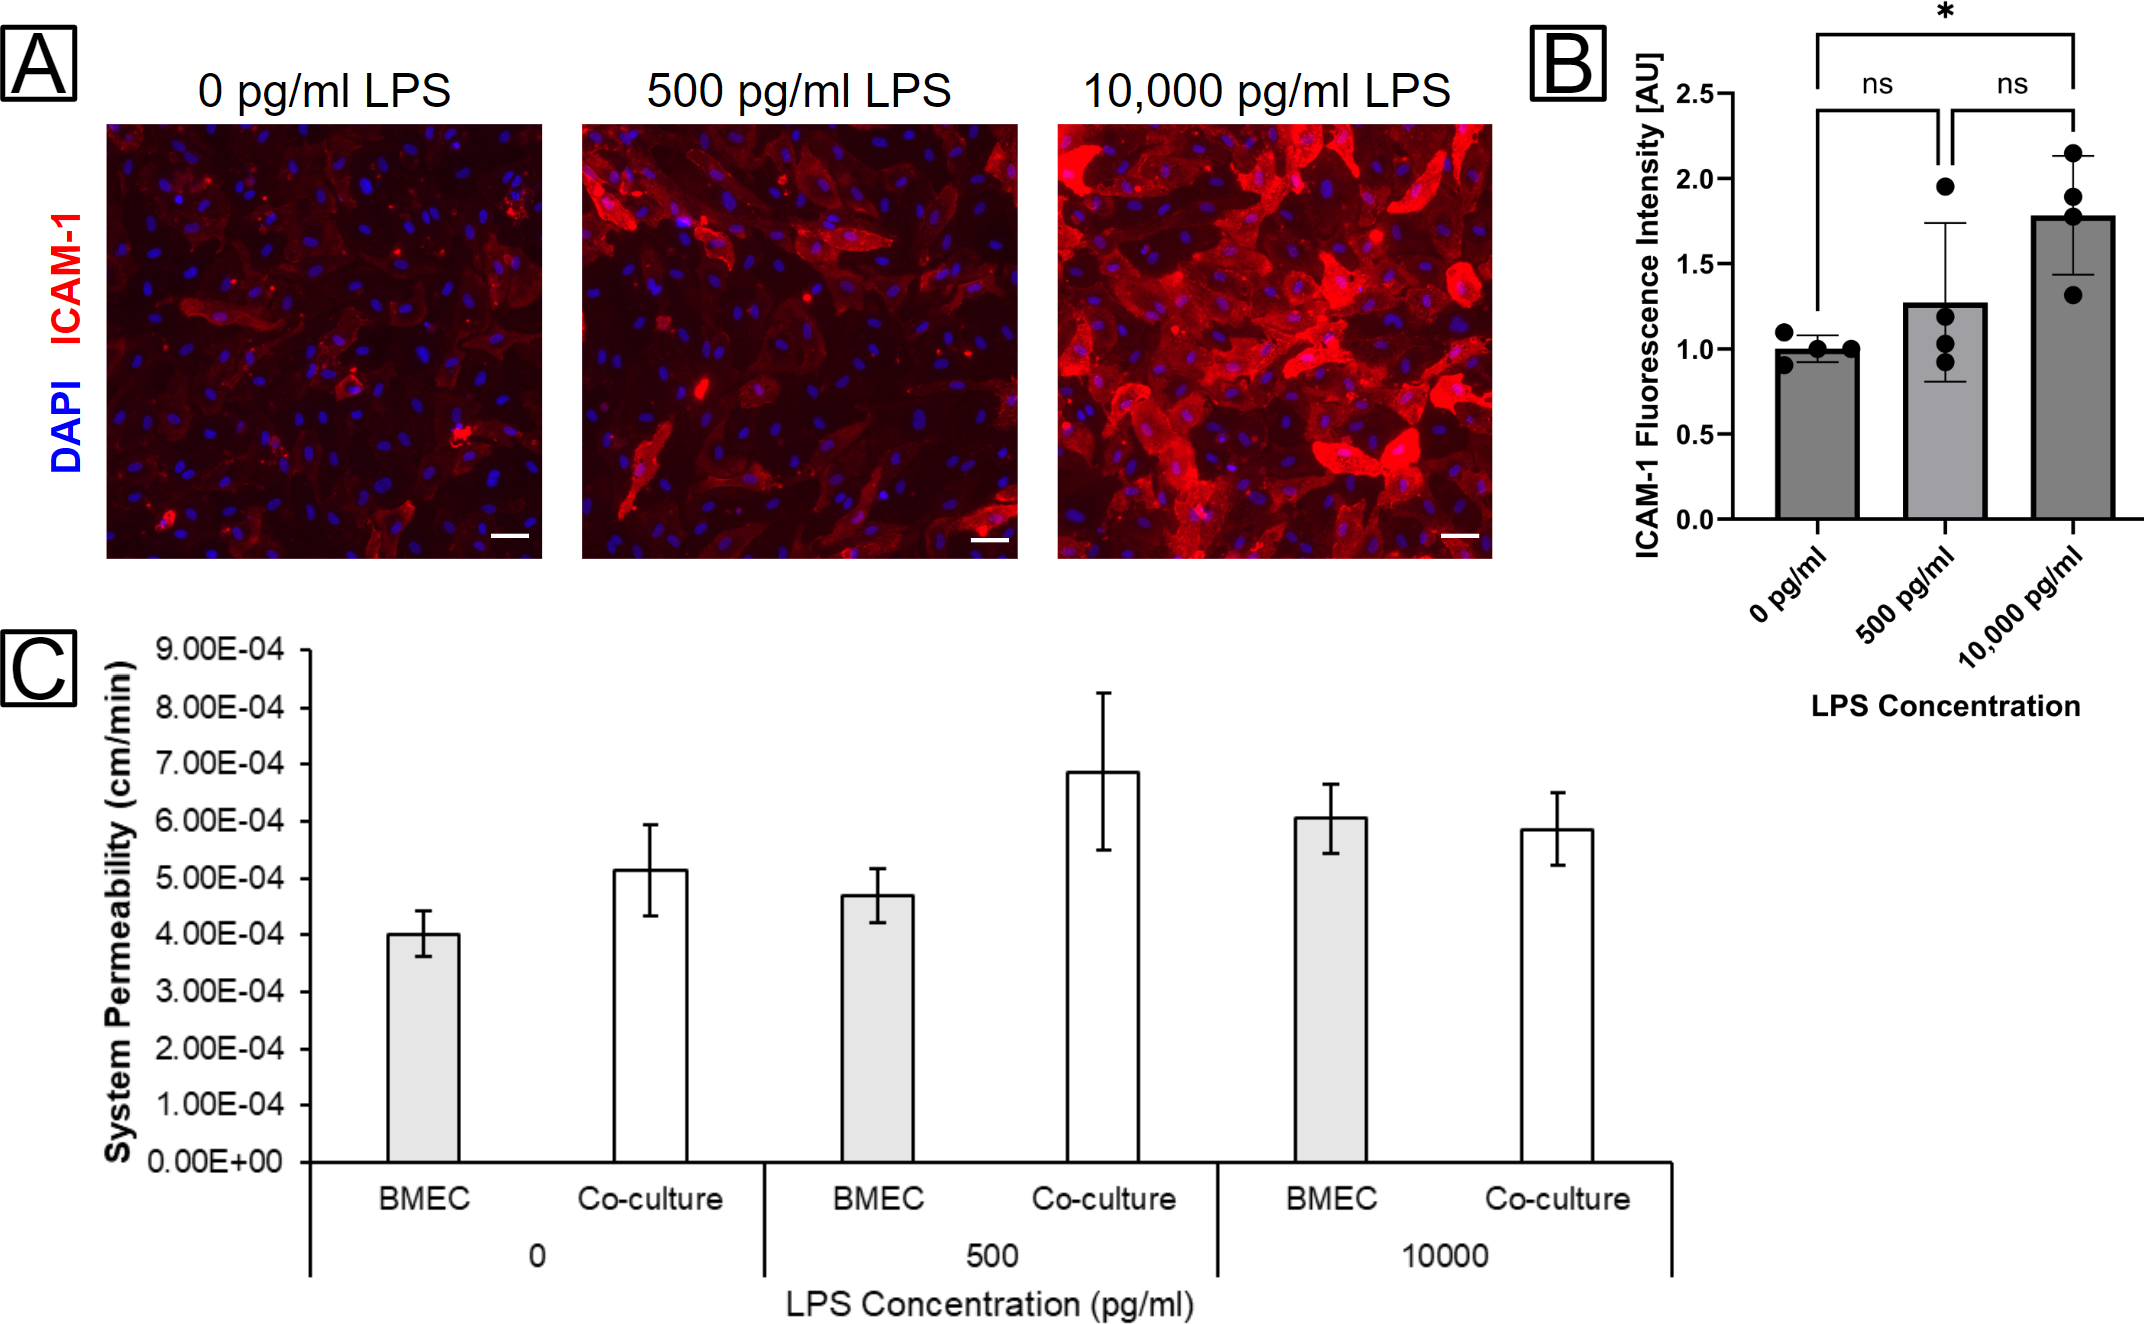
For μSiM experiments, we chose to use two concentrations of LPS: 500 pg/ml and 10,000 pg/ml. The former was one of the higher-end concentrations that have been reported for LPS in the blood of sepsis patients [4], while the latter had previously demonstrated repeatably detectable ICAM-1 activation in our 96-well plate experiments. 500 pg/ml LPS led to a non-significant increase in ICAM-1 activation over the unstimulated condition, but there was a significant difference in ICAM-1 activation after administering 10,000 pg/ml LPS (fig. 4A,B). We were interested in determining whether the presence of BPLCs might modulate BMEC ICAM-1 activation, but quickly determined that this would not be feasible to investigate through fluorescence microscopy since the BPLCs also express ICAM-1 (not shown). Even with confocal microscopy, it would be difficult to discern the boundary between the two cell types due to their close proximity on either side of the ultrathin nanomembranes. However, we have been able to examine whether BPLCs modulate endothelial permeability and tight junction expression. While data collection is still continuing, the current trends show that our BBB model’s permeability to lucifer yellow dye increases with increasing concentrations of LPS (fig. 4C). There is not a clear trend demonstrating if the BPLCs affect permeability one way or the other, though so far it appears that permeability may be higher in co-cultures when there is 0 or 500 pg/ml LPS.

Preliminary data from staining tight junction protein claudin-5 is promising. There appears to be a drop in claudin-5 fluorescence intensity when LPS is administered (fig. 5). However, while junction structures are clearly visible, we have noticed a large number of bright spots affecting our junction imaging. We are still investigating methods to acquire cleaner images. It is worth noting that BPLCs do not yet seem to have an effect on the expression of claudin-5.

Using HUVECs in a 96-well plate, we have acquired our first data showing endothelial ICAM-1 activation by bEVs. 1×10⁸ and 1×10⁹ bEV/ml appeared to increase ICAM-1 labeling intensity in a dose-dependent manner, and even approached the same activation level promoted by our 500 pg/ml cytomix positive control (fig. 6). It remains to be seen how the number of bEVs relates to the concentration of LPS; we intend to use an LPS concentration testing kit to see if we can measure the amount of LPS associated with the bEV samples. We also plan to dose cells with a range of bEV concentrations to see what number of bEVs causes a similar response to 500 pg/ml or 10,000 pg/ml LPS. It will be interesting to see if there are other stimulants associated with the bEVs that may cause an even more pronounced response than LPS alone. While we may continue some preliminary work with HUVECs, our goal is to transition to using the bEVs in the iPSC μSiM-BBB model.

References
[1] H. Nishihara, B. D. Gastfriend, P. Kasap, S. P. Palecek, E. V. Shusta, and B. Engelhardt, “Differentiation of human pluripotent stem cells to brain microvascular endothelial cell-like cells suitable to study immune cell interactions,” STAR protocols, vol. 2, pp. 100563-100563, 2021.
[2] B. D. Gastfriend, M. J. Stebbins, F. Du, E. V. Shusta, and S. P. Palecek, “Differentiation of Brain Pericyte-Like Cells from Human Pluripotent Stem Cell-Derived Neural Crest,” Curr Protoc, vol. 1, p. e21, Jan 2021.
[3] S. M. Dauphinee and A. Karsan, “Lipopolysaccharide signaling in endothelial cells,” Laboratory Investigation, vol. 86, pp. 9-22, 2006/01/01 2006.
[4] J. C. Marshall, et al., “Measurement of endotoxin activity in critically ill patients using whole blood neutrophil dependent chemiluminescence,” Critical Care, vol. 6, p. 342, 2002/05/02 2002.