Membrane dimensions
Below is an optical image that shows the amount of area loss caused by the preferential EDP etch.
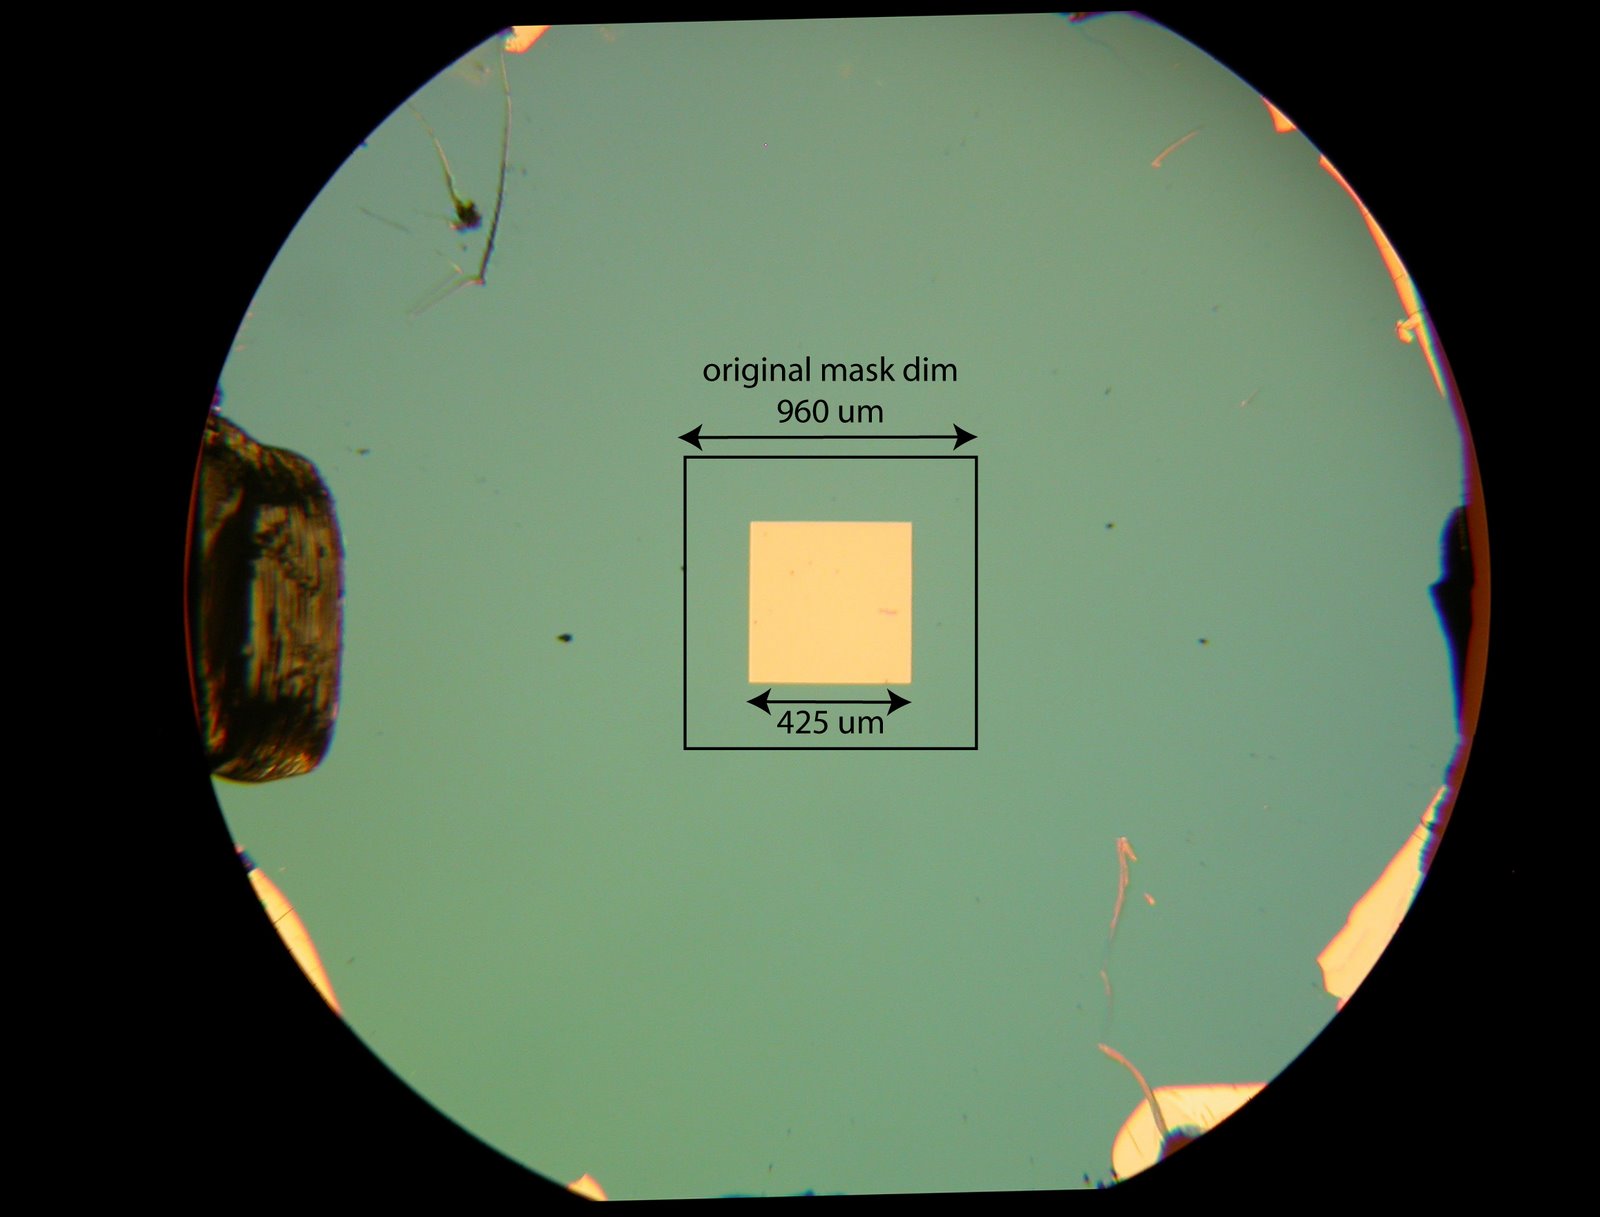
Based on these numbers, our most recent membrane slits measure 115 um x 2014 um.
Below is an optical image that shows the amount of area loss caused by the preferential EDP etch.
Based on these numbers, our most recent membrane slits measure 115 um x 2014 um.
In a previous post I had shown the relative fluorescence of various substrates as normalized to glass. 1um beads (either green or red) were placed onto each surface and imaged with constant EM Gain, exposure time, and intensity. Bar graphs were constructed to show the relative fluorescence (red and green were not normalized to each other)….
Matlab Generated Endothelial Cell Alignment Distribution Top and Bottom Gel No Gel Bottom Gel Run 1 Run 2 Statistical Analysis The next step in this data analysis is to perform some form of statistical analysis. Comparing real alignment data to a set of randomly generated alignments may be a good place to start. Also, comparing the frequency…
When we submitted the EO paper way back one of the reviewers made the following comment … What is the “head pressure” P_max, i.e. the maximum back pressure that would stop the pump? For any linear electrokinetic phenomenon such as EO pumping, the flow rate decreases linearly with backpressure until a certain point (“head pressure”)…
I couldn’t really make sense of what was happening in this post, and in particular this figure threw me for a loop: So to help myself understand the relationship I whipped up a little matlab app to show the relationship a little clearer: Moving the sliding bar on the bottom changes the y-position…
Following the advice of Dave and Chris I ran a UV Ozone bonding trial yesterday with the stage temperature set to 100C (instead of the usual 25C). The idea behind the elevated stage temperature is to drive off any water vapor that might be within the UV Ozone chamber during the treatment process. At the…
I repeated the first degradation experiment (posted here) to confirm the results. I also tracked discoloration of the samples this time. As before, I used 1X PBS, but this time, the entire assay was performed in the 37C oven. Discoloration pictures: The PSi sample starts with a new rainbow coloration and then completely discolors to…