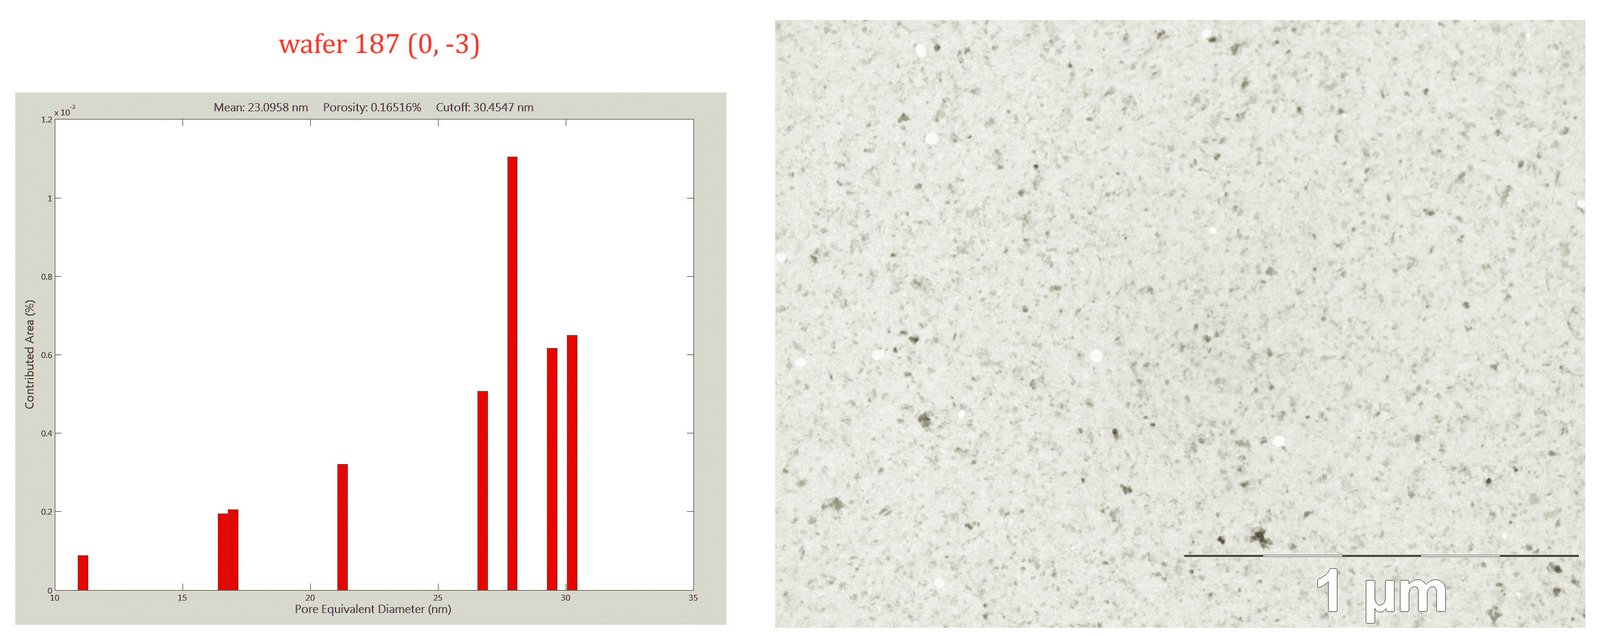
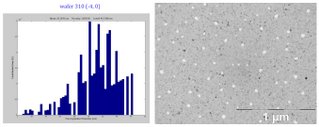
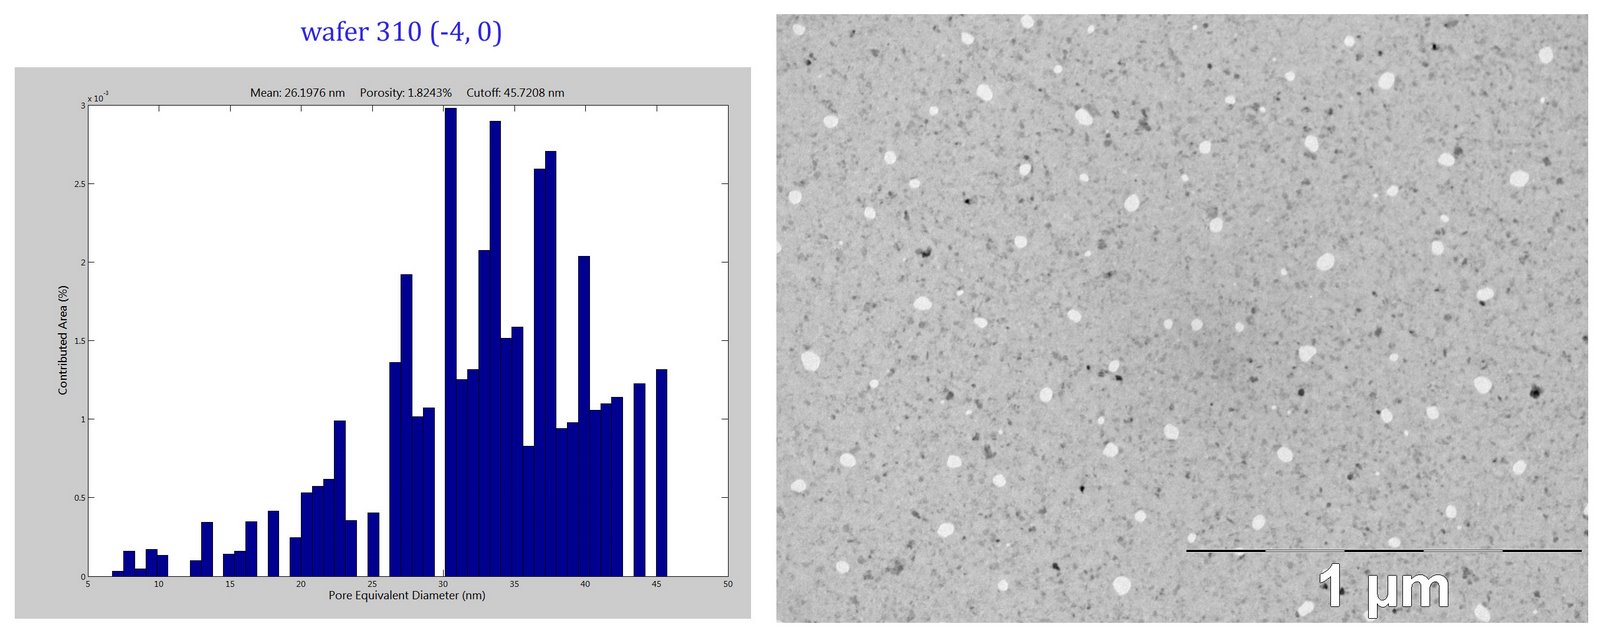
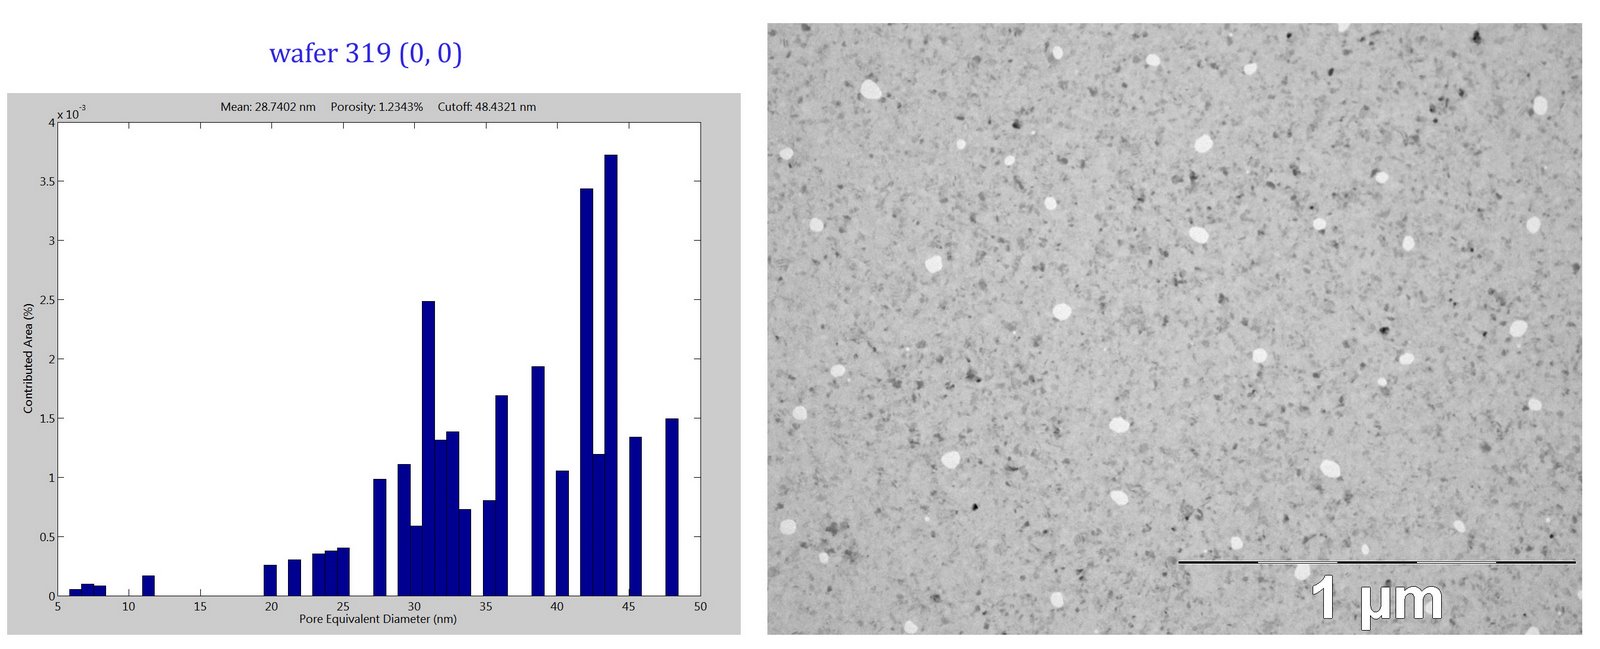
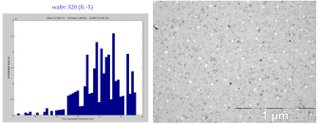
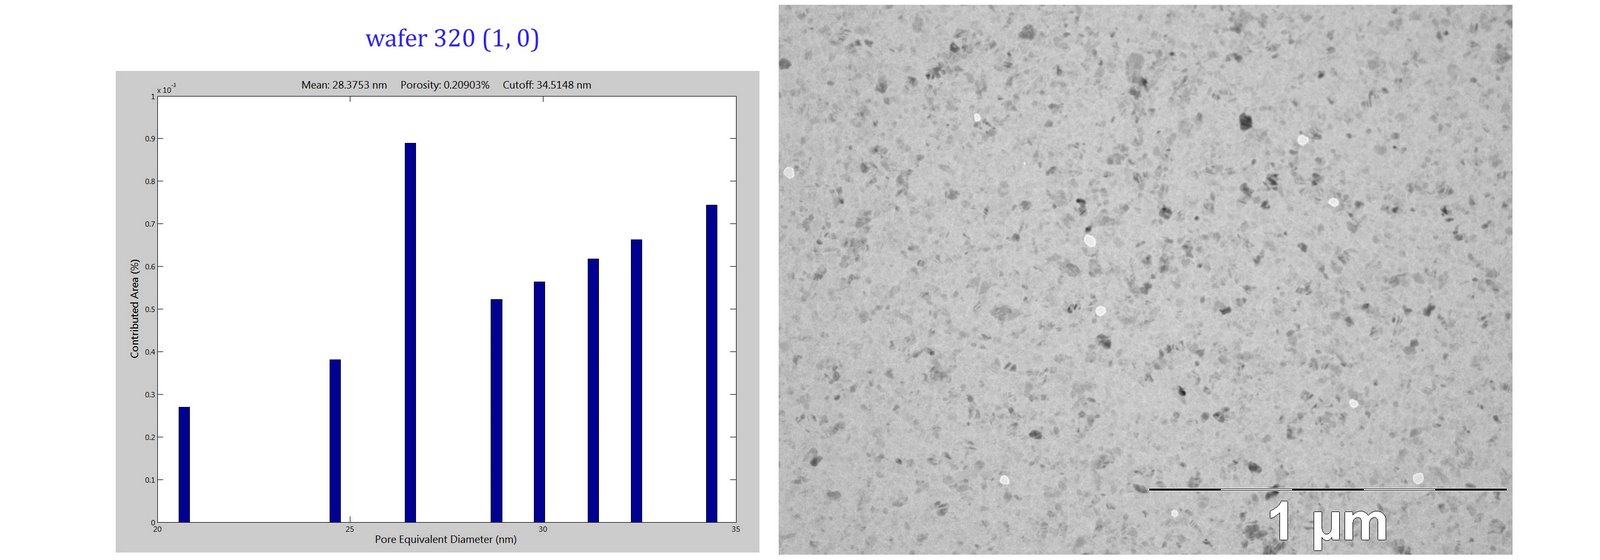
Histograms of recent membranes
Using Mike B.’s MATLAB script, I was able to generate some histograms and stats for wafer 187, 310, 319 and 320. I excluded the “small pore background”, as I do not believe these features go all the way through the membrane.
wafer 187
wafer 310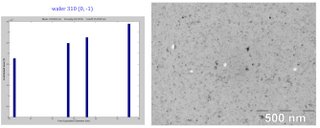

wafer 319


wafer 320

The reason why I did not include analysis for an inner 187 membrane was that the TEM image did not show any pores that seemed to be open… keep in mind, though, that the imaging field is only ~2um x 2um and that there’s a finite possibility that some larger pores exist. In fact, based on Jess’ diffusion results with inner 187, we know that the pores there; just extremely sparse.
Dave, can you send me this data in numbers?
We need to find a way to get our sample are larger and smooth out these histograms. Can you check out how many pixels are in the the smallest pores that you measure and use this information to determine the minimum TEM magnification that can be used? Maybe a 25kx image would work? I think the older histograms were generated at 30kx.