Track Etched EO
I sealed track etched membranes into the usual E-Cell setup. Here’s a chart with the calculated flow rates:
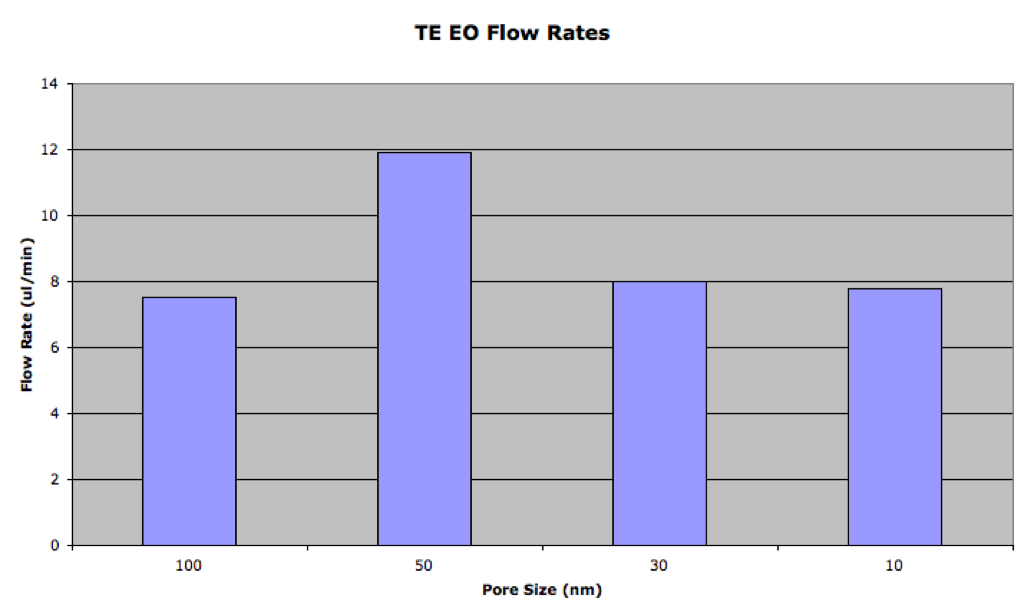
I’m not sure why the 50nm sample was so much higher. Maybe there’s a difference in porosity? Also this is only the first try at this experiment.
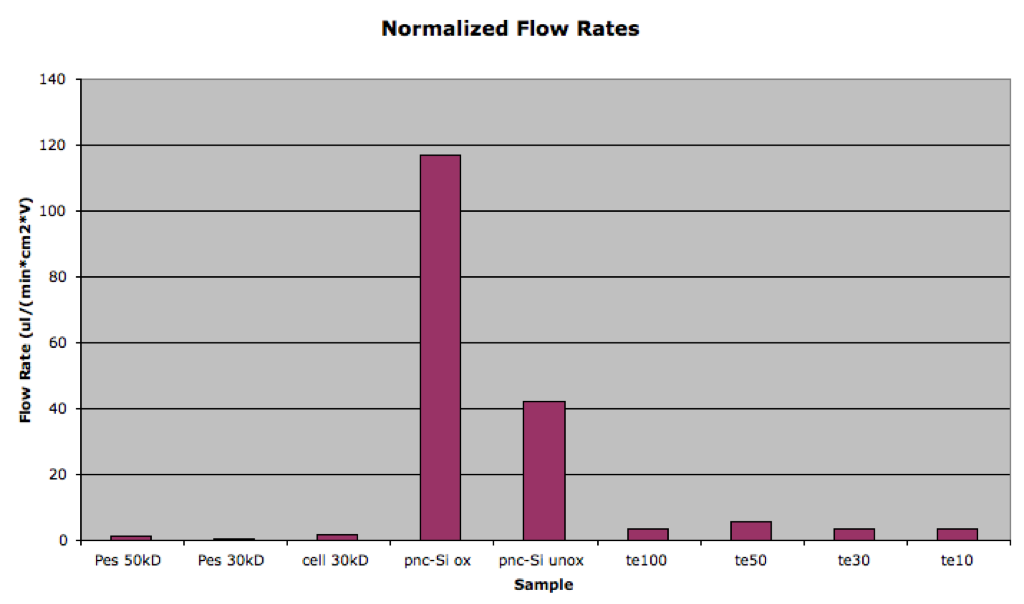
Here’s a chart with flow rates of all the experiments I’ve done normalized to area and voltage:
I also tried to conduct the height experiment again. The apparatus is the E-Cell with a piece of a pipette sealed to the filtrate well with vacuum grease. I used the 100nm track etched membrane in this particular experiment.
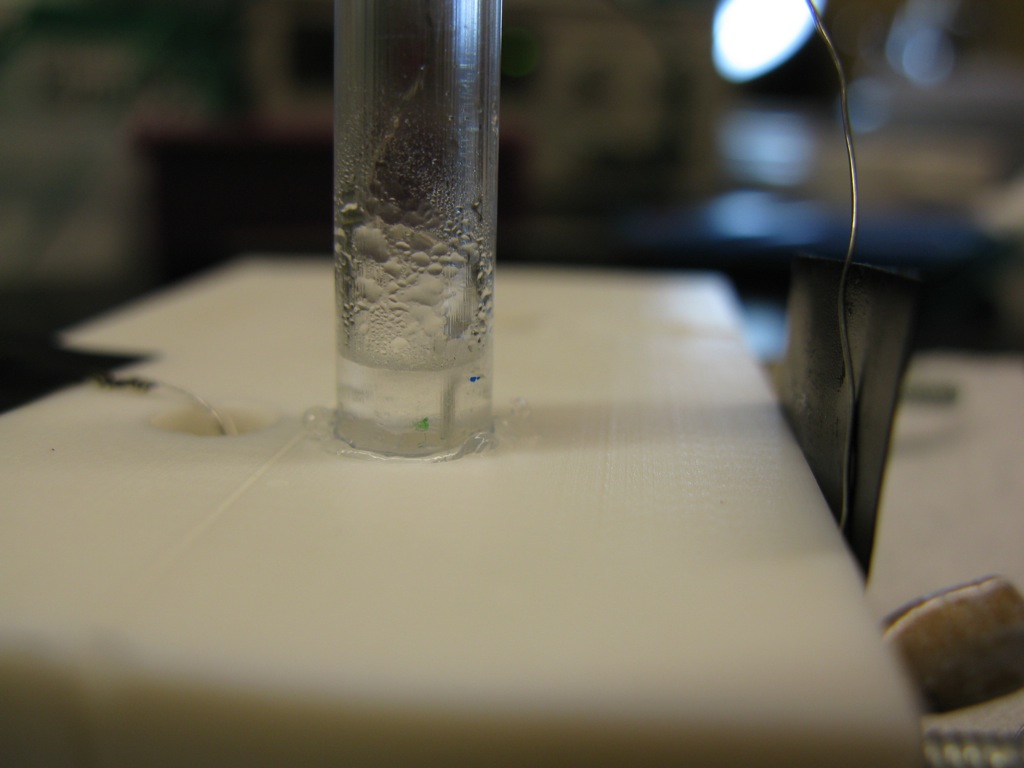
The green mark on the pipette is the starting water level. After about 15min the level rose considerable, as you can see in this picture (look how much higher it is than the original green mark):

The system failed after 23 minutes when water leaked out beyond the vacuum grease. Here are the results up to that point:
- The system had reached 1.5cm in water height.
- That is equivalent to 424uL of PBS (I had to continue supplying PBS to the retentate).
- 1.5cm of water height equals .021psi.
- 424uL of passage means a higher flow rate than I was calculating using my original method for track etched membranes (8.48 ul/(min*cm2*V) instead of 5.4 ul/(min*cm2*V) although the bubbles present in the tube could exaggerate the amount.
- I think this system would have continued to pass water after the leak since the rate hadn’t seemed to slow down by eye.