Sieving curve shift determined by plugging undesirably large pores with large particles
Overview of Experiment
This experiment examined the behavior of the sieving coefficient graph under mixed particle size conditions, where one particle was significantly greater than the average pore diameter, and therefore acted as a “plug” for the larger pores. With fewer undesirably large pores to let through larger particle sizes, the sieving curve steepens and shifts to be closer to the expected model. [Figure 2]
The 2226 SNC membranes have an average diameter of 50 nm, but a photo and histogram of these pore sizes [Figure 1] show how this diameter varies too greatly to make a homogeneous pore size assumption. The applications of these membranes are dependent on the assumptions that their sieving curves can be predicted, the sieving cutoff is sharp, and that their pores are uniform diameter. These assumed membrane properties lead to their applicable functionality. However, the reality of the non-uniform pore sizes greatly reduces membrane application potential because it directly disproves these assumptions and their subsequent particle-size selective functionality.
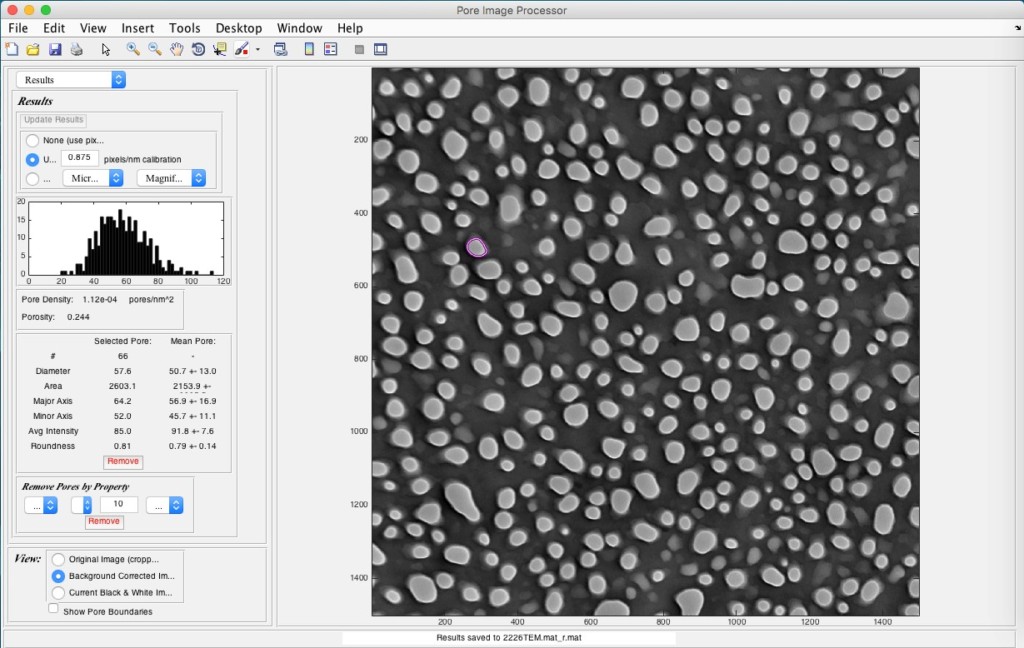
Figure 1: Photo of varying pore sizes and histogram outlining the breadth of the size range. 2226 SNC membranes. The large standard deviations of these pores are depicted in the table below. The size and roundness range significantly narrows the applications of these membranes, as they are not tunable to a certain size or shape cut off.
| Diameter | 50.7 ± 13.0 nm |
| Area | 2154 nm |
| Roundness | 0.79 ± 0.14 |
This spread of pore sizes makes sieving behavior difficult to model for different particle sizes, as the larger pores will both right shift the sieving cut off while also making it less sharp. This behavior is depicted by the black line in Figure 2 in comparison with the proposed mathematical model, depicted in red. The black line was created by running 300 uL solution of increasing particle size through the membrane at 1.3psi, and measuring the concentration of the particle in the filtrate. The green line depicts the same experiment except with 150uL of 100 nm particles mixed with 150 uL of varying particle solution.
Note: The proposed mathematical model was generated using ~10nm diameter different pore size, however the assumption is being made that the slope and location are the same if not very similar.
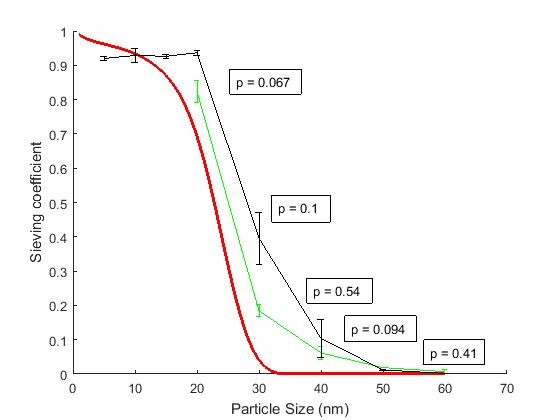
Figure 2: Altered Sieving curve location. The curve shifts significantly to the left, p= 0.067 and p= 0.1, in the region surrounding the pore size average of these membranes in Figure 1.
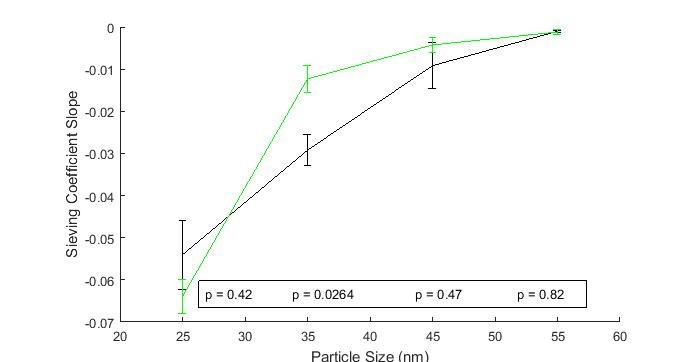
Figure 3: Depicts the differences in the slope of the sieving curves in each size region.
The significance of the data is less promising in the slope graph, with the 100 nm plugs having a steeper curve but a p = 0.42 in 25nm region and the 100 nm plugs creating a shallower curve in the p= 0.026 in the 35nm region. However, 25nm point shows a steeper slope that could be made significant with more tests.
Evidence of “plug” particles favoring larger pore sizes
The large span of pore diameters, table 1, gives a much larger volumetric flow rate (∝ r4) through the larger pores, Equation 2 Poiseuille equation. Therefore, it was predicted that the 100 nm particles would favor the large pores. This would be supported by a sharpening of the sieving slope, as the larger particles would favor the large pores which are letting the larger sizes through. Support for this hypothesis is indicated in Figure 2 at the 25nm particle point when the 100 nm mix slope is steeper, albeit not significantly.
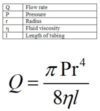
Equation 1
The data adhering to the mathematical model better correlates to a more uniform and smaller pore size, so this supports the fact that the 100 nm favor the larger pores.
Also, the fact that the curve has significantly shifted to the left might also support that the 100nms are favoring the larger pores. The left shift could be due to either decreasing the number of pores (with the 100nm clogging) or preferentially clogging the large pores. This should be tested in the future to add support for the conclusions of the data (see paragraph 2 of “future tests”).
 The experimental data shows the phenomena of the particles favoring larger pores, however imaging the chips after drying them with the 100 nm’s on top did not show this correlation. This is explained by the fact that the only force holding the particles over the larger pores is the flow of the mixture through those pores. Once the pressure was no longer applied then the particles became easy to dislodge. A solution to this issue and the potential benefits of secure “plug” particles is found bellow.
Potential Uses
Large particle plugging can be applied to make the membranes not only more uniform, but also tunable. If the concentration and size of the “plug” particles are is controlled then the shape and location of the sieving graph can be more finely manipulated. The particles can also be removed and replaced with other sizes, so the membrane could be re-calibrated to a different curve.
However, creating permanently altered membranes is not possible with the current structure of these membranes because the large particles easily slip off of the large pores after flow is stopped. A proposal for beginning to fix this problem is outlined below.
Altering the Manufacturing Process
The pores in this membrane are conically shaped, with the wider end facing the exiting side of the membrane. If the membranes were orientated in the opposite direction, cups facing up, and the angle of the conical shape were optimized, then a certain sized particle could be selected in order to fit securely into this cone and plug the hole more firmly without slip, [diagram]. If this can be achieved, then it is possible to secure these particles into these pores semi-permanently enough to make physical handling not disrupt their placement over the pores. This proposal is made under the assumption that there is no particular reason that the membranes are orientated this way, although one hypothetical positive of this orientation is that the particles/fluid is “pulled” through due to a pressure gradient towards the wider opening at the exit. Altering chip assembly in this way would be advantageous if the pore-plugs were to be made permanent or if a cross current flow were to be applied over the membrane surface to help prevent caking.

Diagram: If the membranes were inverted such that the “cup” faced upwards then the general flow (blue arrow) would conflict with minute pressure gradient caused by Bernoulli’s equation 2 (green arrow).
Bernoulli’s equation [eqn 2] would cause a minute pressure gradient that will encourage the particle to flow in the opposite direction of the larger applied pressure gradient. This may cause difficulties with this future test. However, the effect of this force may diminished at such small scales.
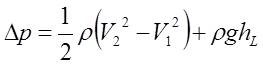 [Equation 2]
Once the membrane is flipped, the conical nature of the pores can be exaggerated and optimized by altering the manufacturing pressure and RIE exposure time.
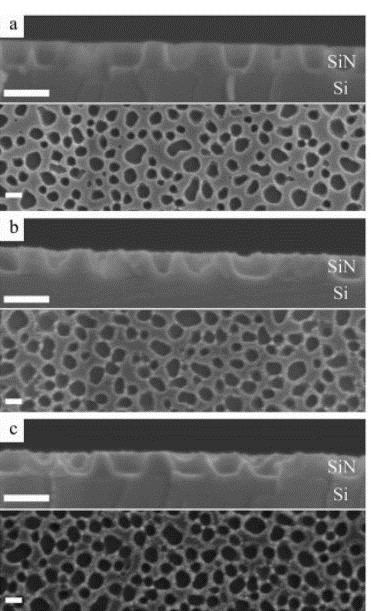
These images were taken with increasing RIE chamber pressures (100 mTorr, 200 mTorr, and 300 mTorr). The more pronounced angles were on the 200 mTorr samples, although a this does not seem significant so more sample photosmay be needed.
[1]
The conical nature 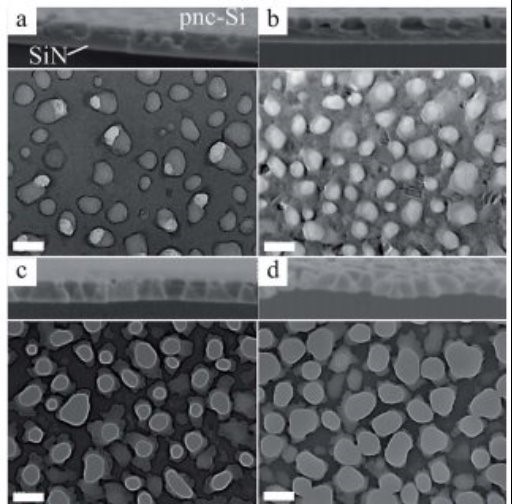 of the pores can be seen in this top-down view of the pores. These chips had an average pore size of 47 nm, so the conical nature would be more pronounced, seen by comparing a to d. These chips were made with increasing RIE times (10s, 20s, 30s. 40s) and the smaller the RIE exposure the more pronounced this angle is.
[1]
Future tests

First, I would like to retest some points from figures 1 and 2 to make sure that the sharper slope is significant. These would be the non-plugged 30 nm particles, and the plugged 20 nm particles.
The left shift of the curve could be due to preferential large pore clogging or general pore clogging. This could be tested by calculating how large an effect pore number has on the sieving curve by running an assay of different particle sizes with some of the windows covered. The target amount of window covered would preferentially be equivalent to the number of pores clogged by the 100nm particles. This would test how large an effect the decreased pore number has on the curve shift without the 100nm clogging. Any difference in curve shift would be due to preferential large pore clogging.
I would like to further study the effects and benefits of using plug molecules that are only slightly larger than the large pore radii. I believe this will make the intentional clogging more stable and better favor the larger pores, as they would be less likely to be jarred by shaking the filter during the filtration process. Also I would like to test if using polystyrene particles as opposed to gold particles make the effects more prominent. These particles do not sink and are lighter, so they would be more easily pulled towards the larger pores by the increased volumetric flux.
If possible, I would like to test different mechanisms for making this plugging more permanent. This could be done through flipping the membrane and having the plugs nestle into the large pore pockets more securely, or adding another step after the initial manufacturing process where particles are somehow permanently attached to the silicon membrane.
References:
[1] Desormeaux, J. P., Winans, J. D., Wayson, S. E., Gaborski, T. R., Khire, T. S., Striemer, C. C., & Mcgrath, J. L. (2014). Nanoporous silicon nitride membranes fabricated from porous nanocrystalline silicon templates. Nanoscale, 6(18), 10798. doi:10.1039/c4nr03070b
[2] Concentrations of 100nm gold: http://www.bbisolutions.com/molar-concentration-of-nanoparticles/
