Water Permeability Figure
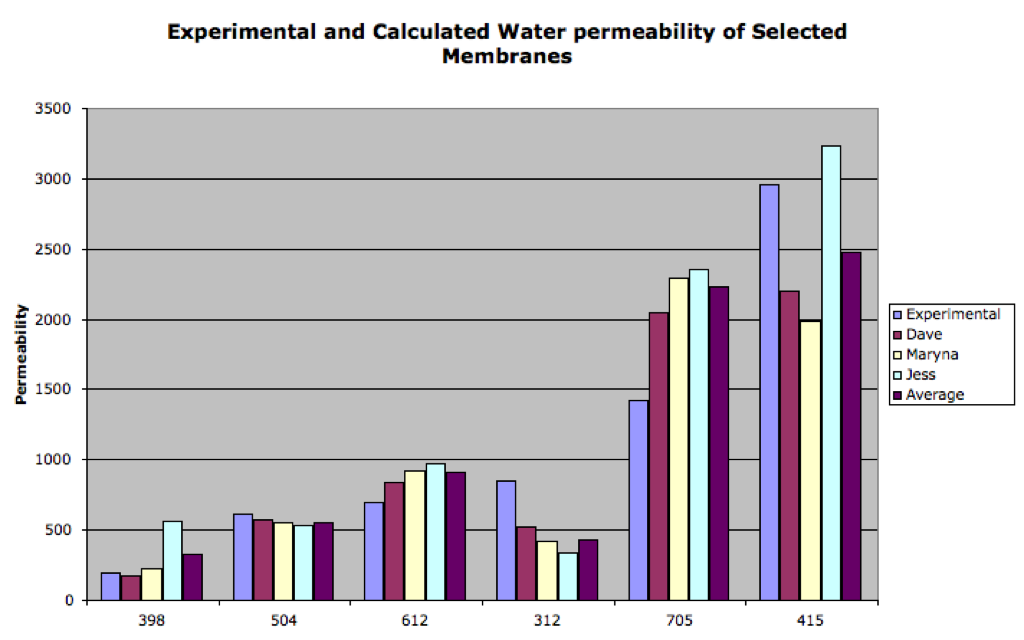
We discussed in meeting having Maryna also calculating the permeabilities for this figure. Here is a figure with the experimental, theoretical permeabilities from Dave’s, Maryna’s, and my processing, and an average of the three theoretical permeabilities.
I then took this average and made the following figure. I did omit w312, as the super low permeability and poor image statistics threw things off. (Sorry for the excessive use of pink…)
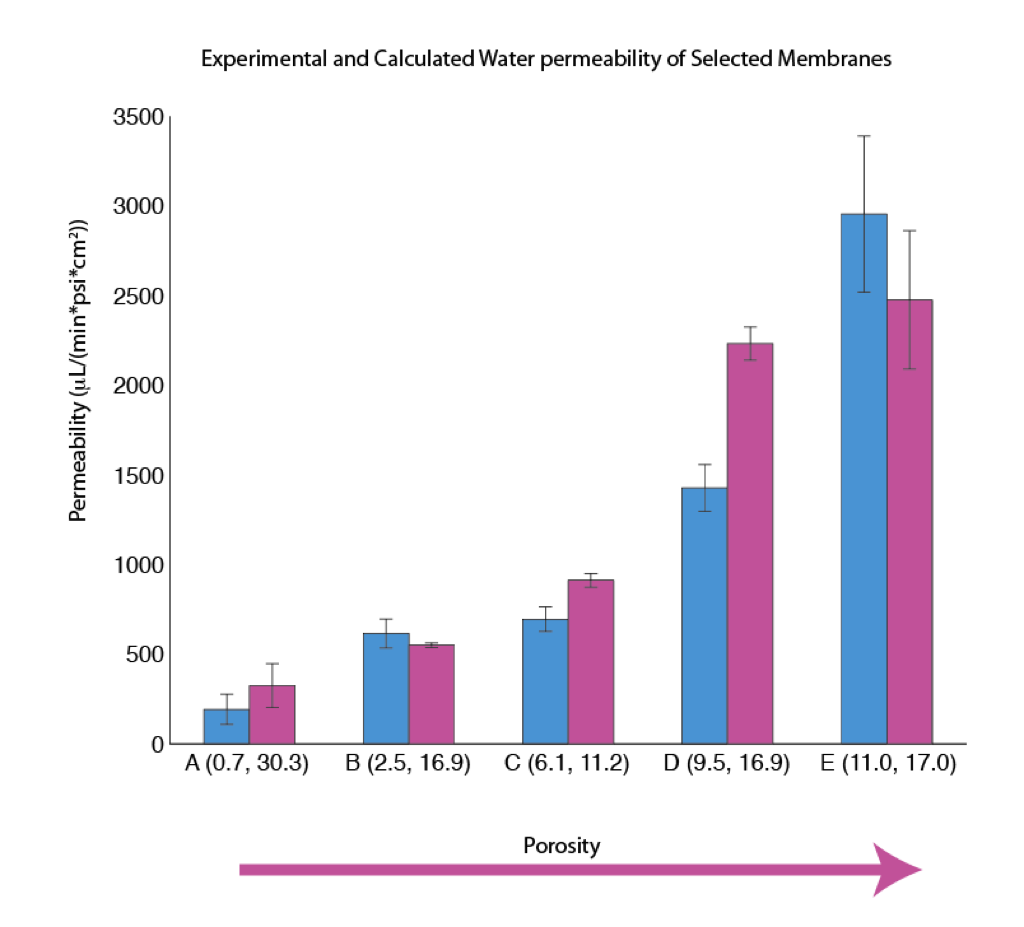
Tom and I had a discussion about standard error vs. standard deviation. The previous figure uses standard error for the error bars. To find the standard error you divide the standard deviation by the square root of the number of samples. This means the more samples you measure, the better the average is getting to the “right” average, so your error decreases. However, we think that because we are testing different samples from different positions on the wafer, there should be no expectation that by measuring more samples you’ll get closer to one “right” mean. If perhaps you measured one chip 10 times, standard error might be reasonable. This is totally up for more discussion, but here’s a redone figure w/ standard deviation error bars instead.
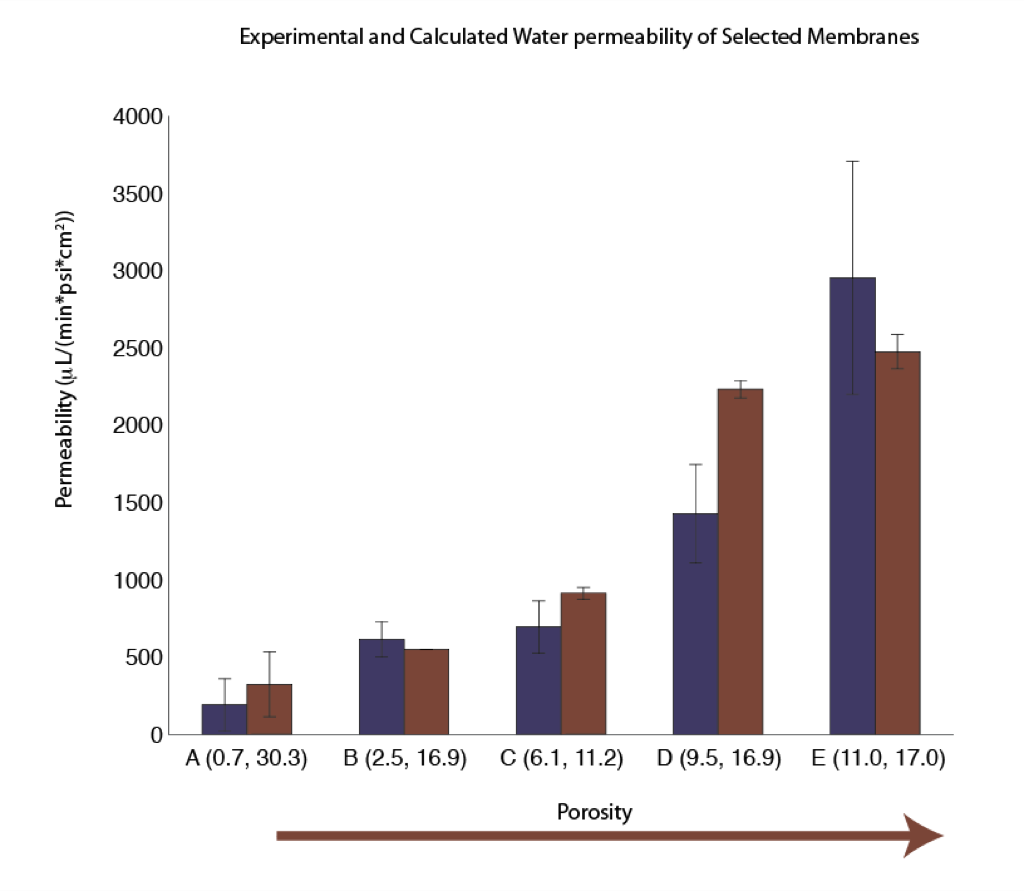
Note, this still does not completely fix the discrepancy between the experimental and theory. A few people are suggesting forgetting the error bars completely.
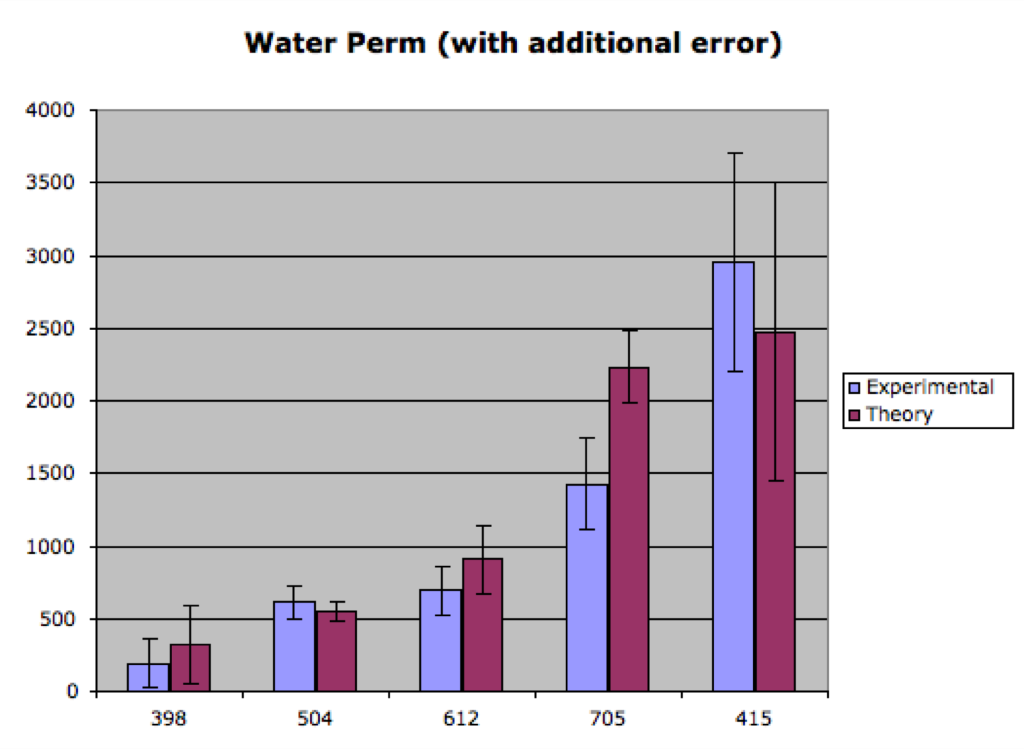
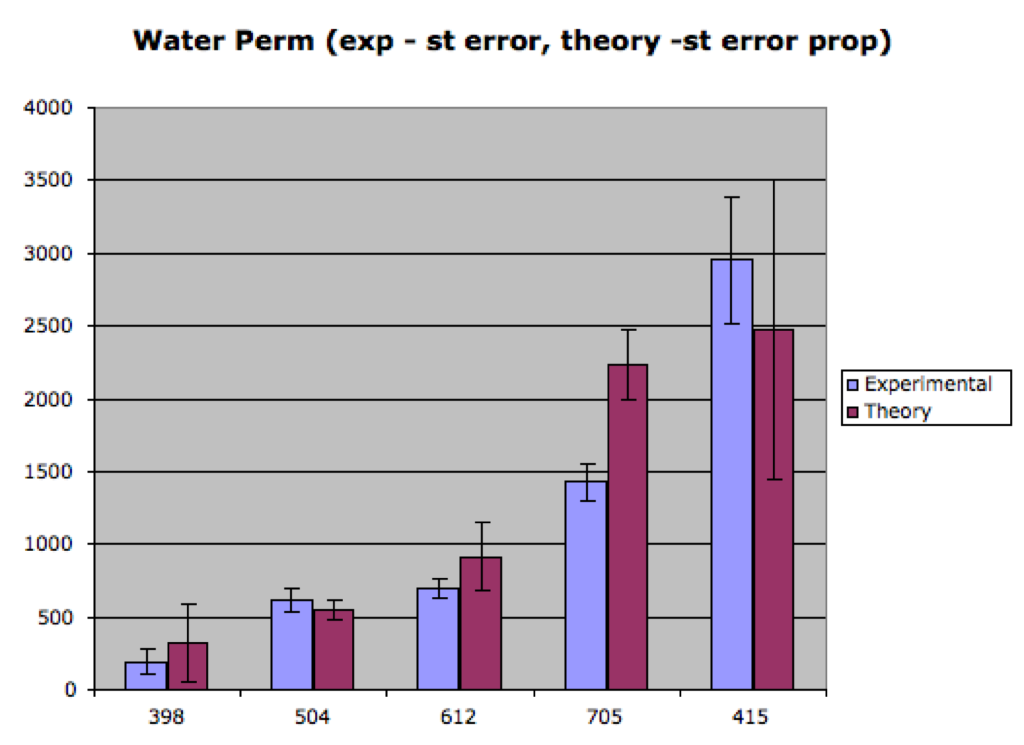
One thing we may have missed is the error across the wafer in addition to the error created by the different processing. For this next chart, I’ve taken:
sqrt( wafer standard error ^2 + processing standard error ^2 )
for the calculated permeabilities. I’ve used standard deviations of the experimental permeability as discussed in the above paragraph. Here is the figure:
Same plot with standard error for experimental. Given the previous argument, I think I lean more toward using standard deviations rather than standard error for this.
I don’t know what reviewers will see, but I’m a little concerned about the error bars not overlapping at all in C and D. To me that says that our model fails for these 2 samples. I suppose we could remove the error bars or find a way to make them larger by accounting for some other effect. Is there anything about these images or wafers that we could blame for the discrepancy?
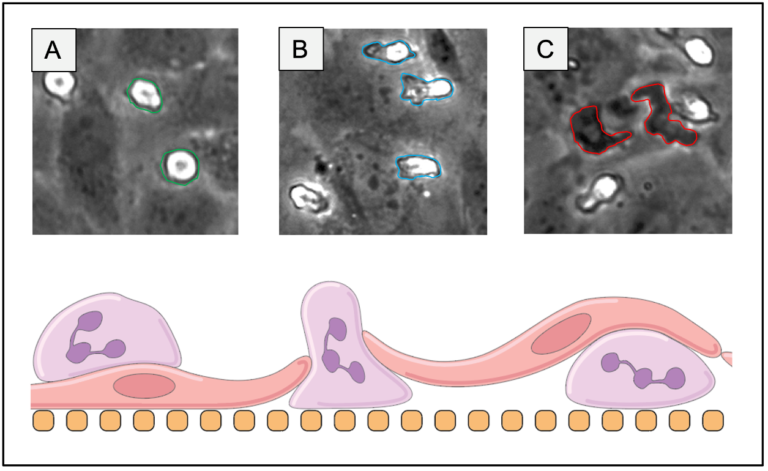
Both w612 aka ‘C’ and w705 aka ‘D’ had a fair amount of background texture. It’s possible that we’re overestimating the porosity of these membranes (supported by Jess’ graph). We could go back and be more discerning with what qualifies as a pore and recalculate to see if that gives a better fit…
Does anyone see a problem with recalculating the pore sizes until they fit our experimental data? Isn’t that a little arbitrary? Couldn’t there be a problem with our model, bad wetting or something that reduces the experimental permeability, or a difference in pores between TEM and actual sample location?
There is some water amount left on the walls of the device after the experiment. For bigger volumes it is probably not much, but for smaller may influence a lot. Did you stop all your experiments when they reach particular volume or was it different volume every time?
If the pore processing algorithm is adjusted for one sample, it has to be adjusted for all of them. Maybe getting rid of the error bars is the best approach, since the effects of wetting and not imaging the sample directly are unknown. Without the error bars, I think the hand-waving is more convincing…
Maryna, we recorded water passage using a balance to measure the weight of the water either remaining behind in the sepcon or passing through to the filtrate. Any errors in recording should really be minimized.
Lets see a version of the last figure with standard error please.