High Resolution TEM at UR – fairly easy
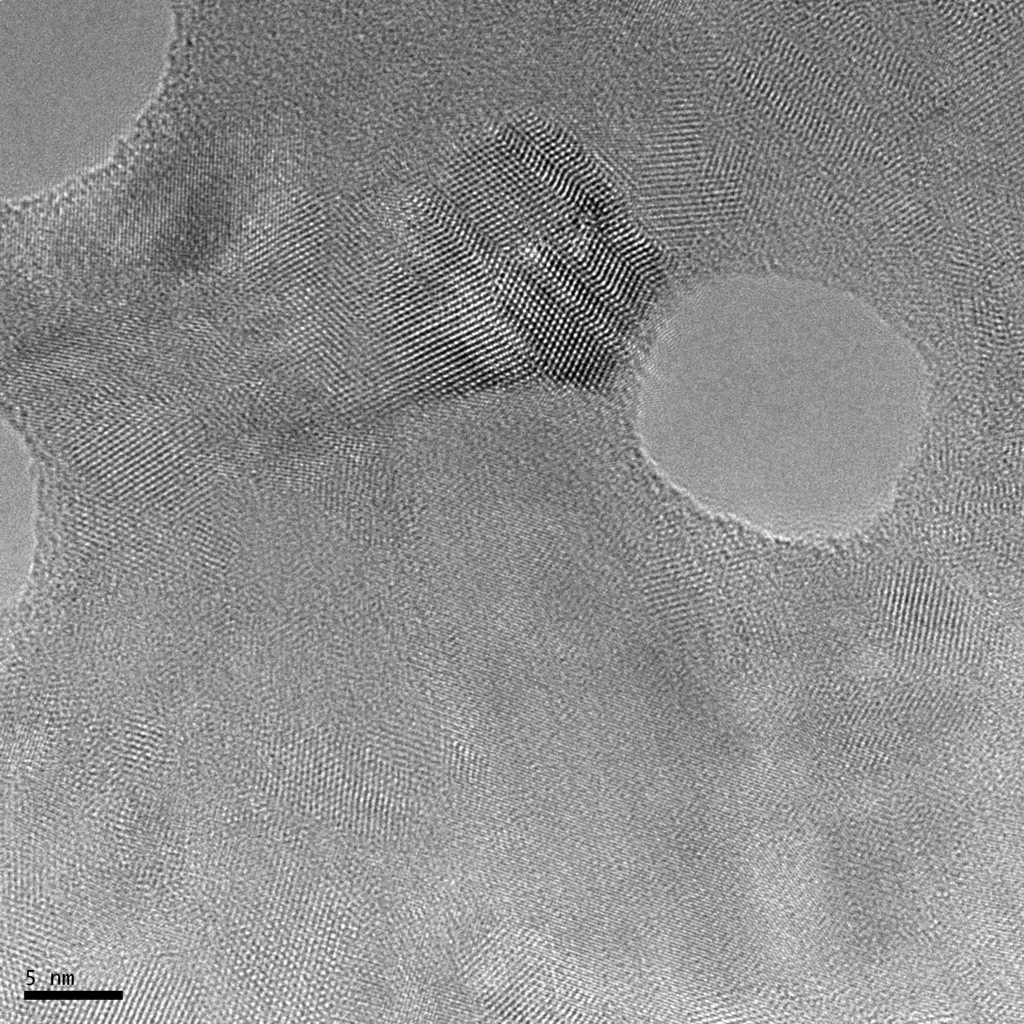
I did some imaging on the URinc TEM today and took the nice image below from wafer SC021. I wanted to see the correlation between highly diffracting (dark) crystals in our standard lower resolution TEM and the lattice fringes observed at high-res. In the image, the very strong <111> lattice fringe area to the upper left of the small pore is highly diffracting at low-res. This is not completely surprising, since the first order diffraction peak for <111> is ~0.5 deg (extremely oblique). I’m a non-expert, but I think the dark crystals that we see in low-res TEM may all be well-aligned <111> nanocrystals. Also notice that there does appear to be an amorphous band between this crystal and the pore wall. However, keep in mind that this “band” is <1nm thick and the pore is 15 nm deep, so it may just be some roughness or non-cylinderical pore effect. Anyway, it’s great to have this capability and it’s soooo much easier to get lattice images on the new machine than the old machine (5 min vs. 1 day).