PSi and pnc-Si degradation, again
I repeated the first degradation experiment (posted here) to confirm the results. I also tracked discoloration of the samples this time. As before, I used 1X PBS, but this time, the entire assay was performed in the 37C oven.
Discoloration pictures:

The PSi sample starts with a new rainbow coloration and then completely discolors to Si grey after a day. The pnc-Si samples start as different colors (w612 is old, SC085 is new) and completely discolor in a day.
Here is the raw data from the colorimetric degradation assay. There was a marked increase in silicic acid at the 1-day time point compared to the 0-day time point for all samples except for silicon with a 50nm oxide. This confirms that these samples are degrading into silicic acid. The Si+50nm oxide sample showed an increase from 1-4 days, which indicates that the oxide layer slowed degradation compared to the bare silicon wafer. Not surprisingly, PSi yielded the most silicic acid. The pnc-Si samples also yielded a signal, but it is not definitively from the pnc-Si side of the samples.
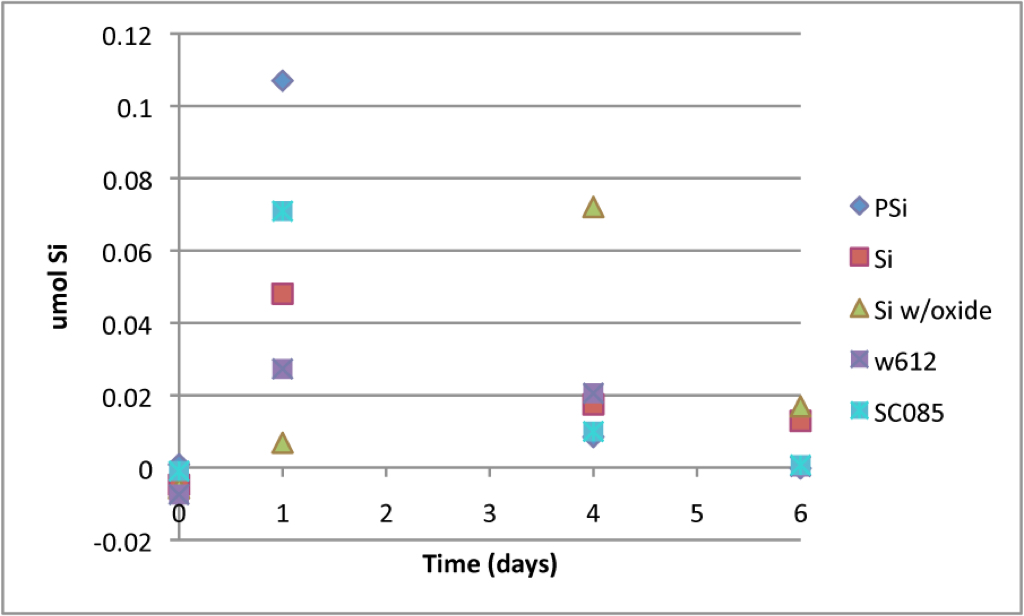
I did a quick calculation of the internal surface areas of the pores of PSi, w612 and SC085. PSi had ~ 1000X the internal surface area of pnc-Si. Therefore, if this graph was normalized to the silicon surface area, the pnc-Si samples actually yielded more silicic acid than the PSi samples. Next up: trying to confirm that the signal from pnc-Si samples is from pnc-Si and not the silicon backside.