TE membranes air permeability
This is preliminary data for air permeability in track-etched membranes for membranes with different pore radius.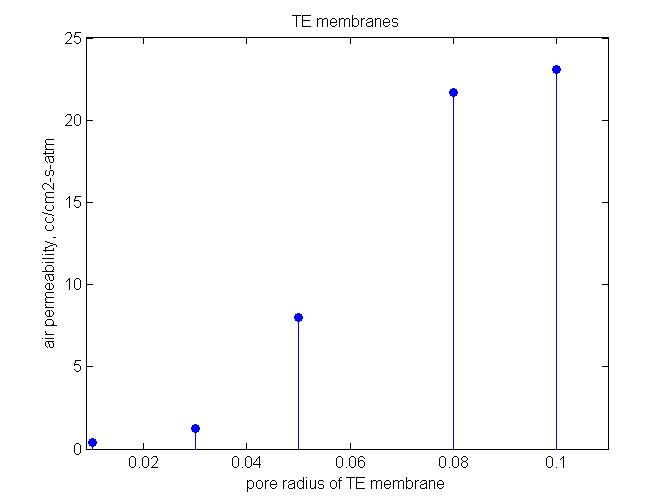
For comparison here is a table of the performance characteristics for TE membranes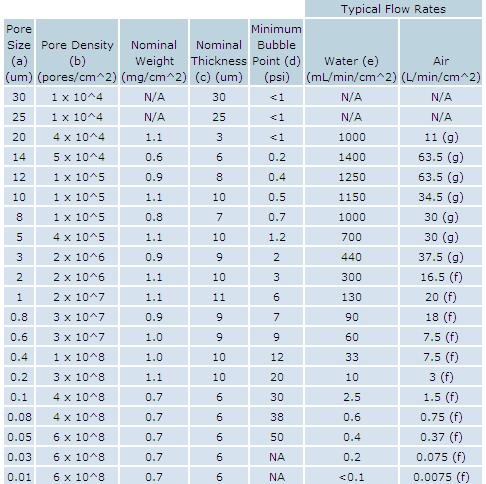
Measured data is of the same order as official TE membranes data.
At what pressure was the data in the table acquired?