Pore Processing Results, 6/15/09 update
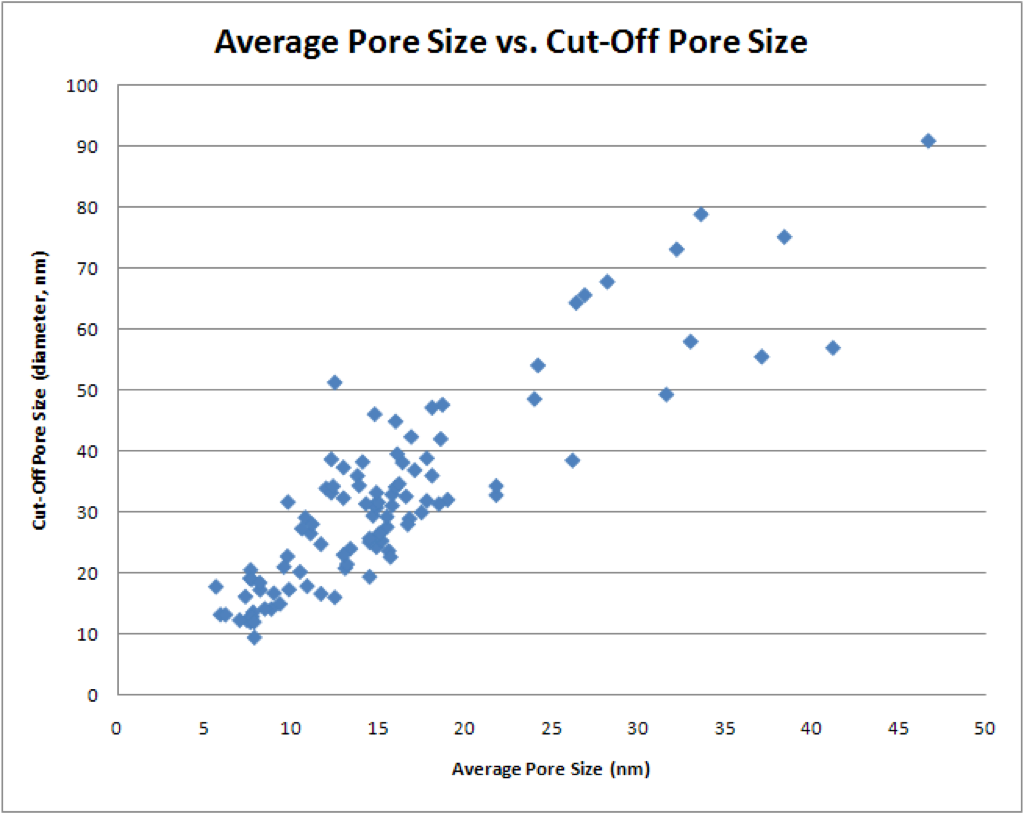
Here are the updated pore processing graphs:
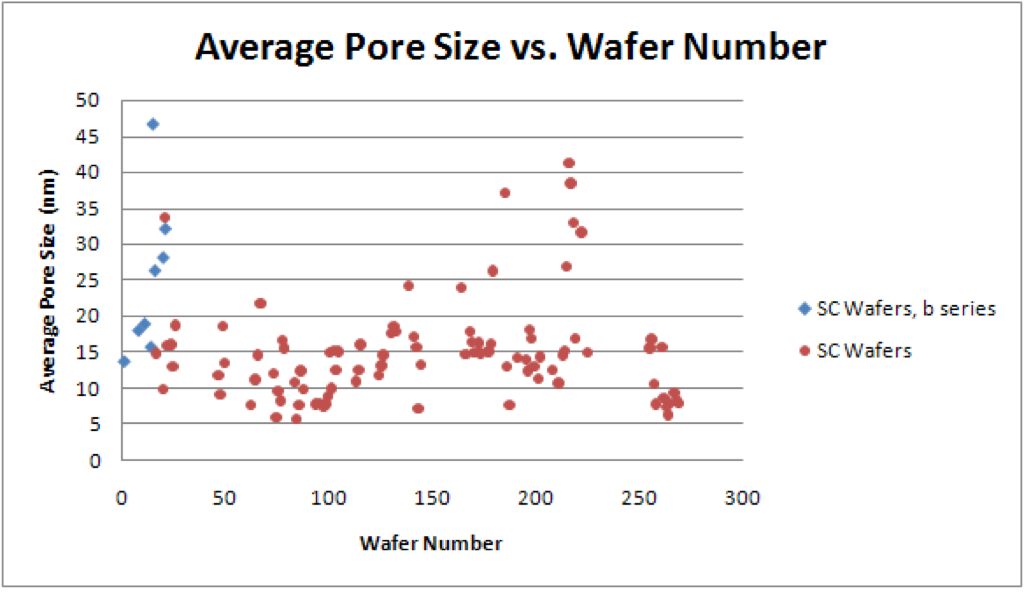
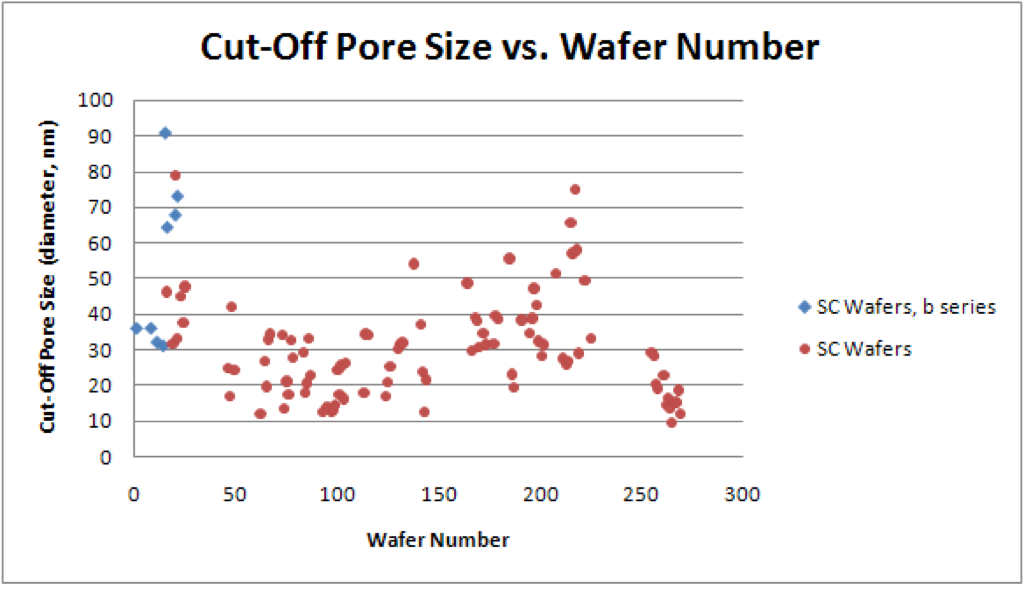
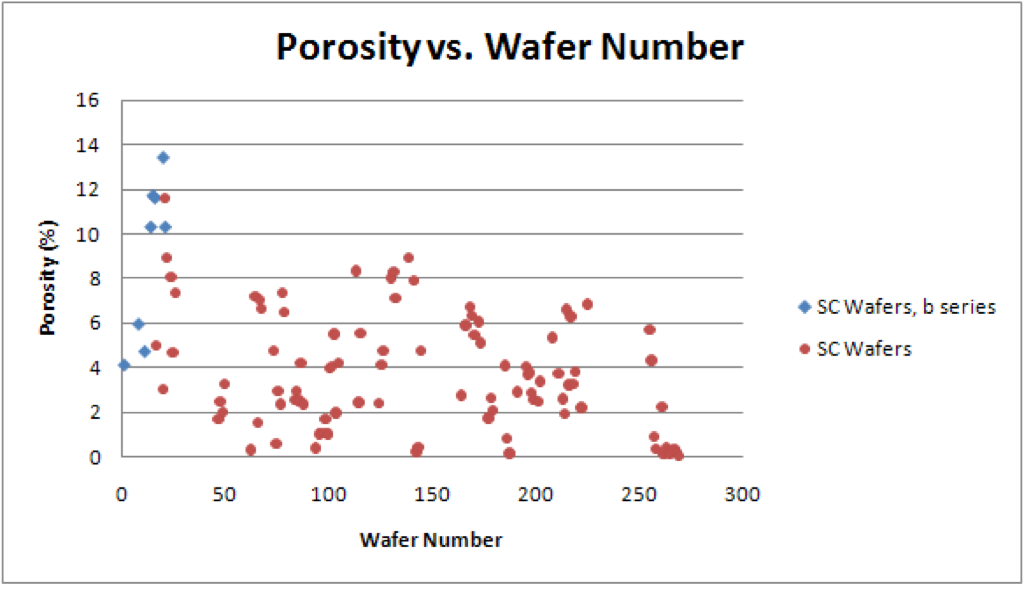
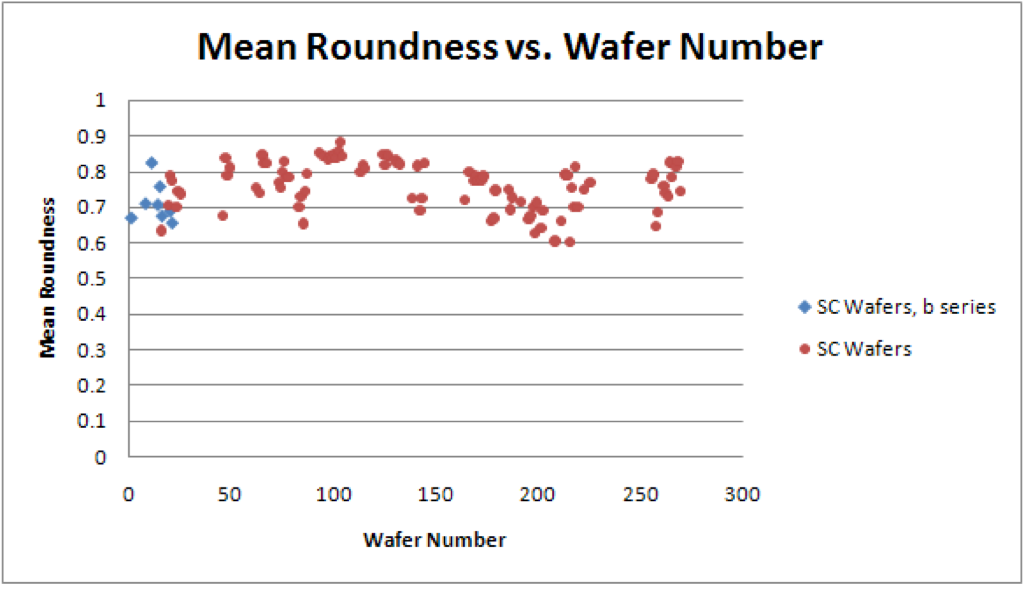
The data spreadsheet: pore-processing-results
Supplement (added 6/16/09):
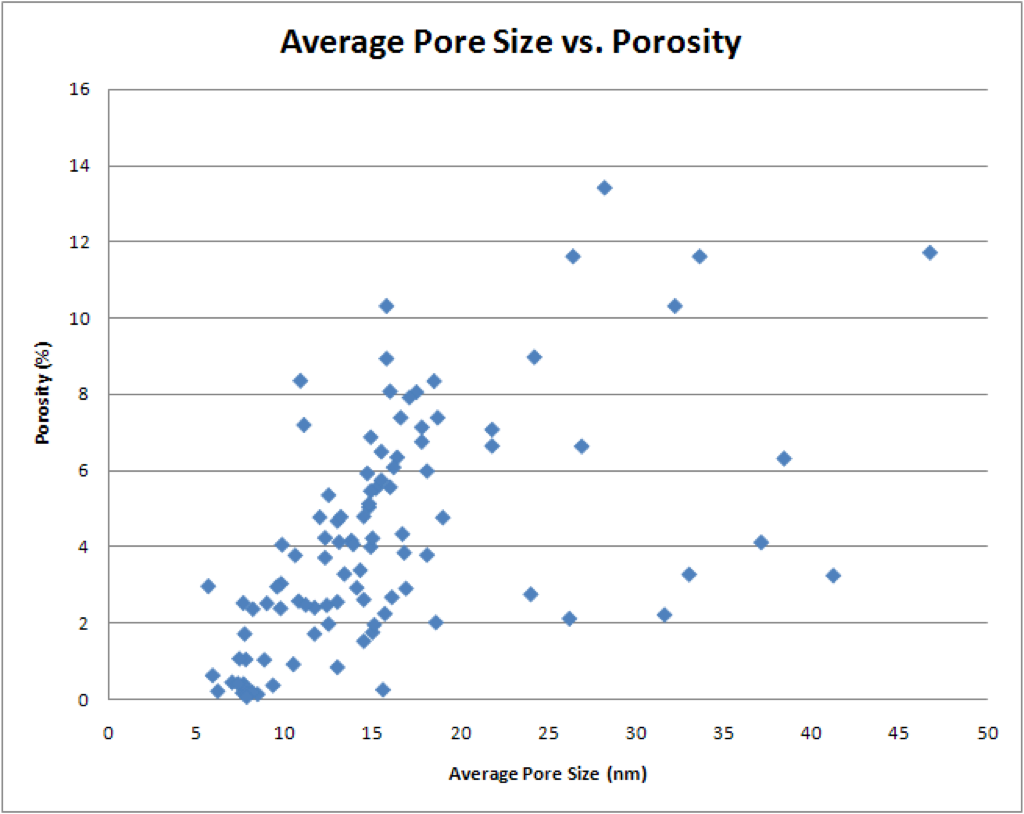
Here is the Average Pore Size vs. Porosity graph with the outlying data points labeled:

After making this graph, I looked at the outliers to see if they were due to my errors. A few were and I redid them, updating the graphs on this page. To the left of the major cluster, there were a couple of points where I had counted the background texture as pinholes (causing a higher porosity than expected with a small average pore size). After redoing those wafers, they fall right in the major cluster. However when I redid several of the wafers where the points fell to the right of the major trend, their positions on the graph did not change significantly. Dave and I think they are true oddities where the wafers have just a few large pores, resulting in high average pore size and low porosity.
I updated this post after redoing several of the outliers. Now, I believe, the plots are more accurate and better reflect the true characteristics of the wafers.