Playing with the model
This is an update of my progress with the diffusion model.
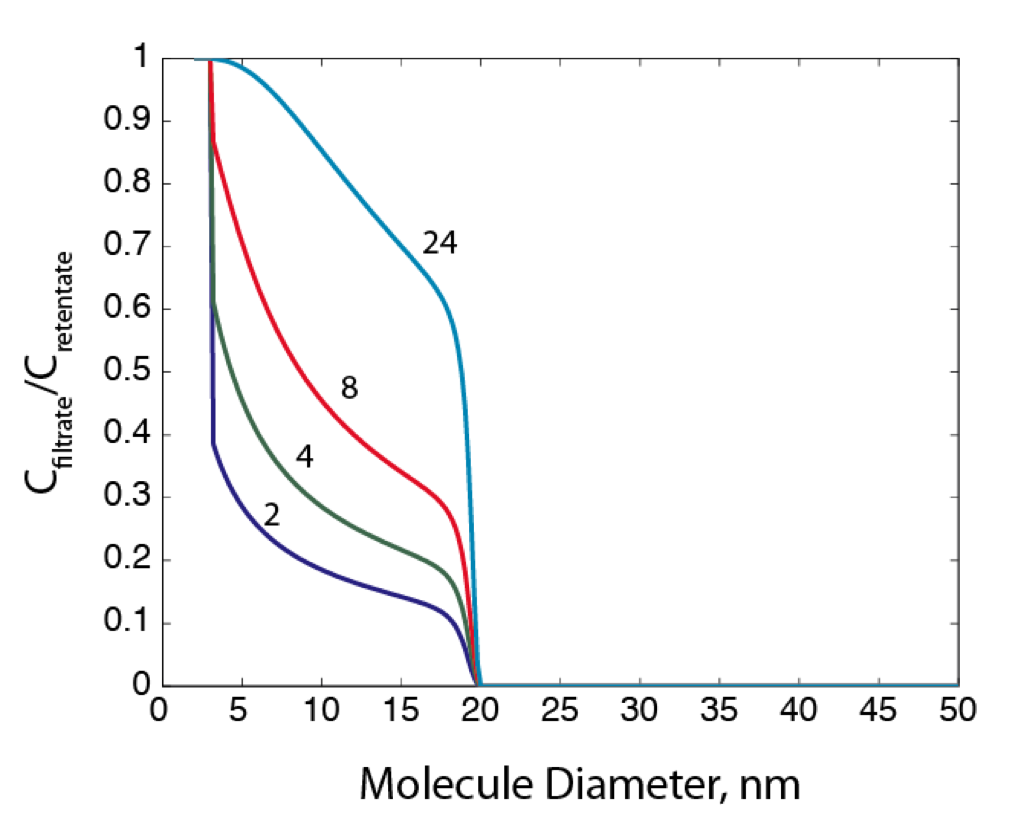
Sieving coefficients for standard setup (Renkin only)
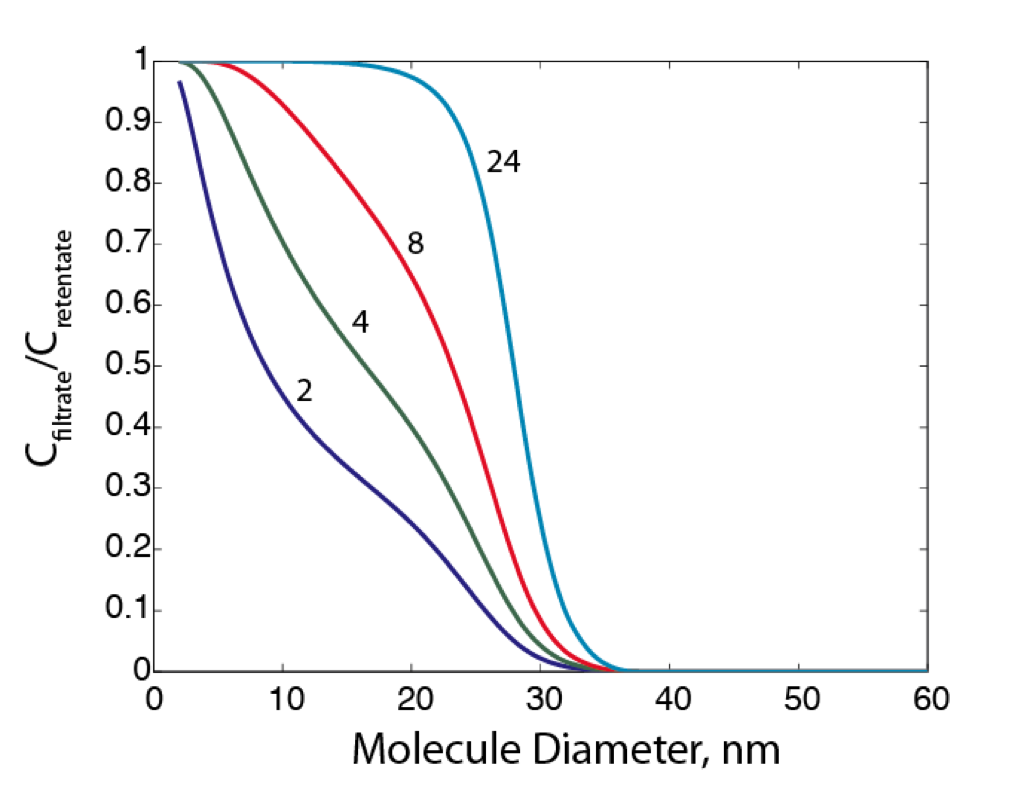
In this image there’s a strong sigmoidal curve for the 24 hour diffusion. However, the cutoff (~34nm) is higher than cutoffs found in experiments. The lower time curves have unexpected shapes. This may be due to the pore distribution or an error in the model.
What I want out of this model is a similar sigmoidal curve to the 24 hour one here, but one that is shifted to the left, which would indicate a lower cutoff.
I have altered this model to contain both Renkin and Adsorber, or Amemiya, resistances, however there is no change in the graph as Renkin resistance is much higher than the Adsorber.
Sieving coefficients (Adsorber only)
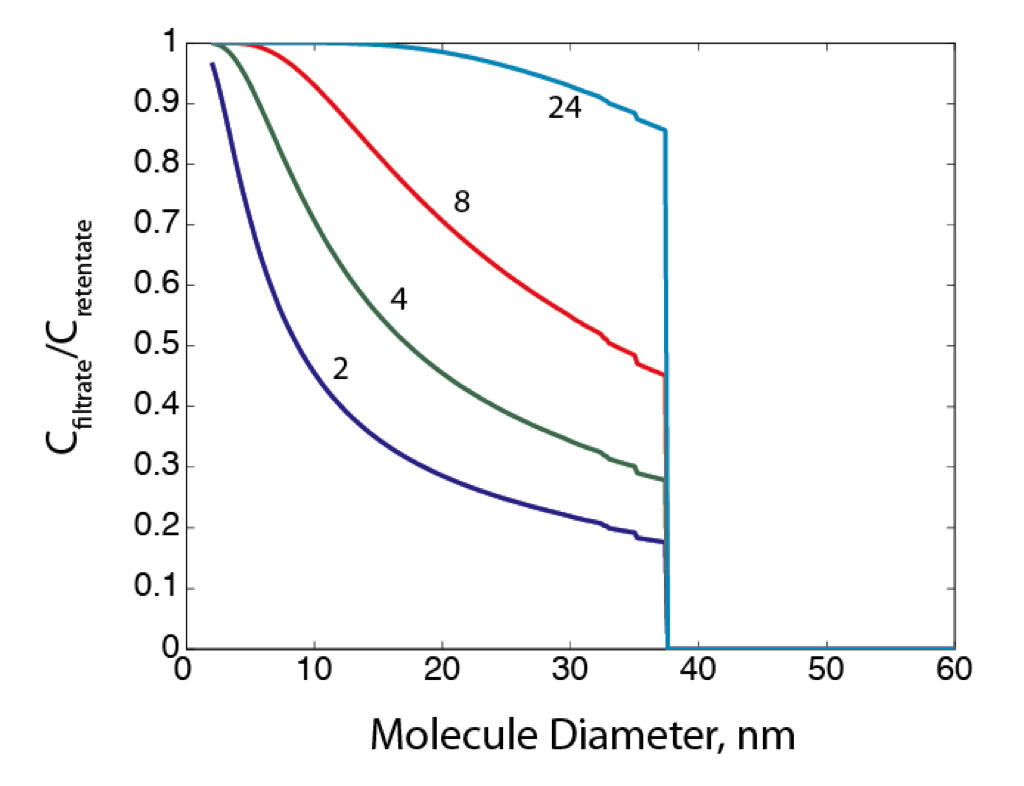
This model uses only the Adsorber resistance. I’m calling it Adsorber because it comes from literature diffusion to capture, or adsorption, at the surface. This is also related to the permeability found in the Amemiya paper and can be thought of as being dominated by the diffusion to the pore rather than through the pore.
In the above chart, there is no hinderance imparted by a pore. If the molecule is smaller than the pore, it diffuses through (that is why there is such a strong drop off at the last pore). As the molecules get bigger, their diffusion coefficients become smaller. So the reduction in diffusion seen in this figure is a combination of pore histogram and diffusion coefficient.
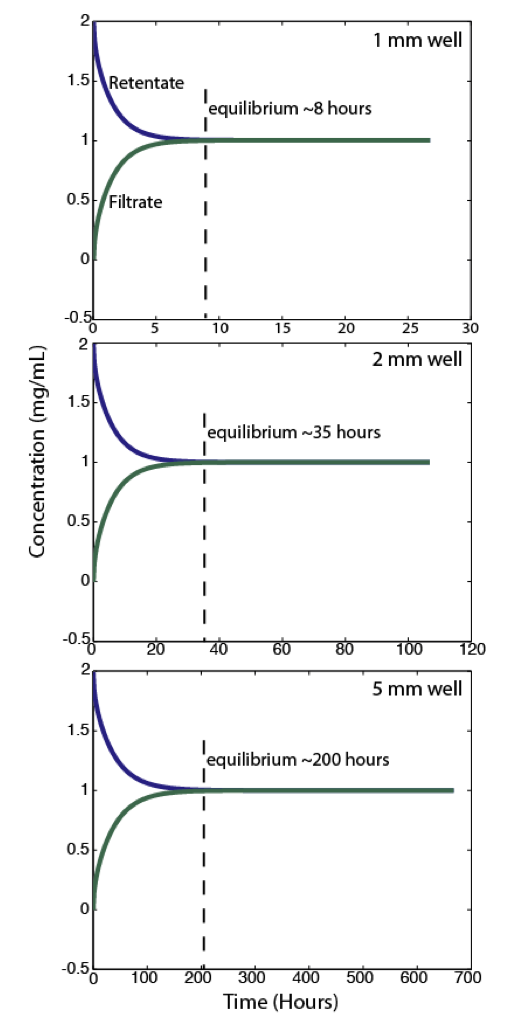
Changing the length changes time to equilibrium
It seems that length of the wells has a big effect on the time it takes for a molecule to reach equilibrium. Here are several plots indicating the time until equilibrium for an albumin sized molecule (diameter = 6nm). This means that our 3D diameter of experiments must be considered.
Sieving coefficients if the wells are elongated
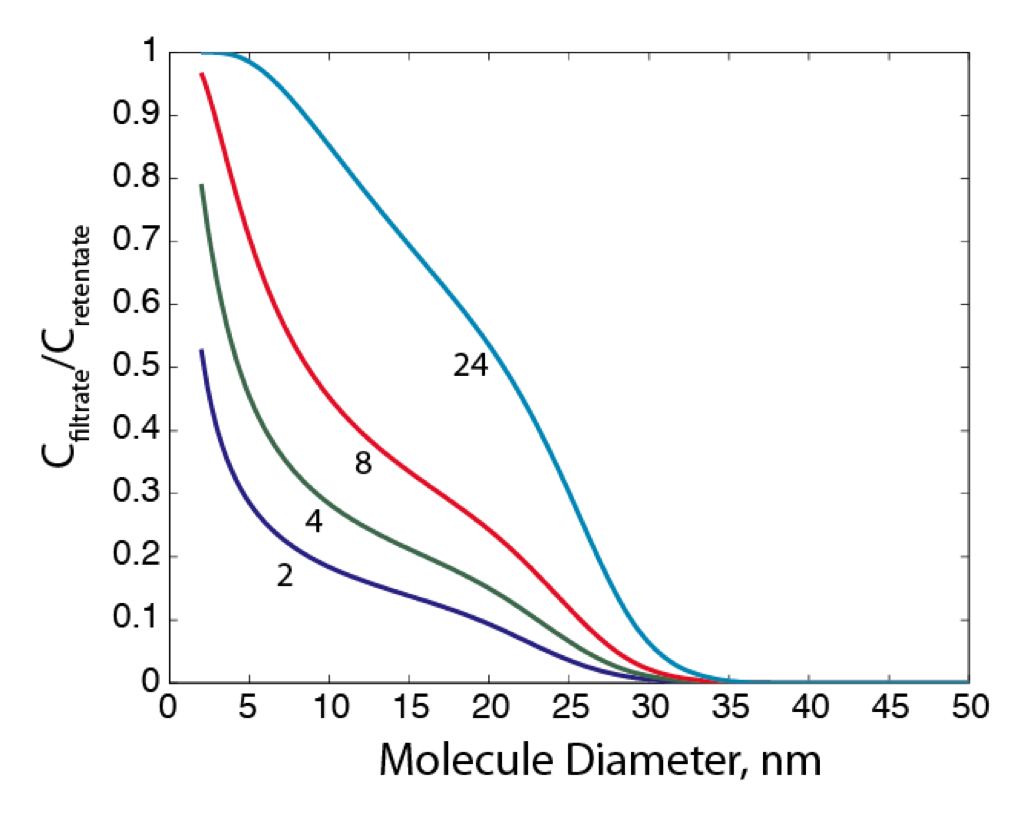
Here is a plot for the sieving coefficients if I lengthen the wells. It seems that the sieving curves retain the same (strange) shape as the first figure, except the time points are retarded for the longer wells. The 24 hour curve in this figure is similar to the 8 hour curve in the first figure. This was not what was expected; we want to move the inflection point of a sigmoidal curve toward the left. This is probably an error with the model, but may also be affected by the pore distribution.
Sieving coefficients for monodisperse membrane
In this case I tried to take out the pore distribution by making a monodisperse membrane with only 20 nm pores. This figure does not look like what I expect, as molecules just under 20 nm are making it through the membrane fairly easily and there is a strange abrupt change in sieving around 5 nm for the lower time points.