The Effect of Pressure on the Sieving Coefficient of a 20nm membrane with 10nm gold
It was speculated that the rate of diffusion through a charged membrane had a direct relationship with pressure – as pressure increases, the kinetic energy of the charged particles is more likely to overcome the electrostatic repulsion of the membrane, until at a high enough pressure the repulsive force is small enough to be ignored.
To investigate this hypothesis, I measured light scattering of the filtrate of 20nm membranes with a 10nm gold particle solution at 6psi, 8psi, and 10psi. I intended to include .5psi and 2 psi in that, but for some reason any pressure less than 6psi failed to move any water through the membrane at all – even when I had wet both sides.
Results:
| 6psi | ||||||
| time (m) | absorbance | % of original gold | ||||
| 5 | 0.03395 | 8.101385 | Average: | |||
| 10 | 0.033475 | 6.1746425 | 8.6895485 | |||
| 15 | 0.034625 | 10.8393875 | ||||
| 20 | 0.0345 | 10.33235 | Sieving Coefficient (S/So) | |||
| 25 | 0.033925 | 7.9999775 | 0.08 | |||
| 8psi | ||||||
| 3 | 0.042075 | 41.0588225 | Average: | |||
| 6 | 0.03865 | 27.165995 | 30.1068125 | |||
| 9 | 0.0375 | 22.50125 | ||||
| 12 | 0.04155 | 38.929265 | Sieving Coefficient (S/So) | |||
| 15 | 0.0371 | 20.87873 | 0.3 | |||
| 10psi | ||||||
| 3 | 0.073175 | 167.2097525 | * Some of the filtrate must have evaporated out overnight | |||
| 6 | 0.047325 | 62.3543975 | ||||
| 9 | 0.043175 | 45.5207525 | Average: | |||
| 12 | 0.046125 | 57.4868375 | 77.8089005 | |||
| 15 | 0.045875 | 56.4727625 | ||||
| Average excluding 3min: | ||||||
| 55.4586875 | ||||||
| Sieving Coefficient (S/So) | ||||||
| 0.55 | ||||||
The relationship is clearly direct, as we expected, but to fully characterize what is likely a logistic curve I’ll need to take a few more data points at higher pressures. The Pressure V. Sieving coefficient is plotted below, with the dotted line representing the logistical curve we are looking for:
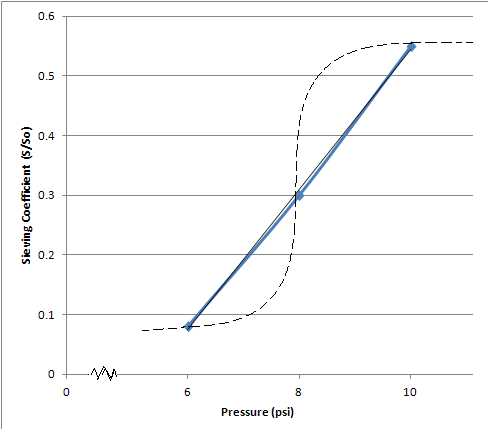
These values, or at least the sieving coefficient of 10psi, agree with values in Tom’s ACS nano paper – he reported for filters with apparent cutoffs greater than 10nm, 10nm gold particles under 10psi of pressure pass through with a sieving coefficient of ~.55 (High-Performance Separation of Nanoparticles with Ultrathin Porous Nanocrystalline Silicon Membranes Thomas R. Gaborski, Jessica L. Snyder, Christopher C. Striemer, David Z. Fang, Michael Hoffman, Philippe M. Fauchet, and James L. McGrath ACS Nano 2010 4 (11), 6973-6981)
Great. Can you create a plot of your data like the one we discussed in the office?