Permeance/Porosity and Burst Pressure
Permeance of a sample was first calculated by taking a TEM image of the membrane and extracting pore size histograms. The flow rate through each pore can be calculated and then summed to determine the flow rate through the sample. The flow rate is then normalized by the pressure and surface area to calculate permeance and then porosity can be calculated. Joe and I set up an experiment to measure the flow rate and prove the numerical values from the image analysis are true. The setup included the use of a u-tube. One side of the u-tube was connected to a nitrogen tank which was used to apply the pressure. The other side of the u-tube was connected to a block that held the sample. We used a valve to allow the nitrogen to go through when we opened it. The setup was very similar to that of Maryna’s except Maryna added extra tubing that was used to purge the tubing with a specific gas. We did not need that extra tubing because we were just measuring air permeance. We first took many samples from a couple of different wafers that had different top oxide thicknesses. We applied a certain pressure and measured how much the water rised in the u-tube in a certain amount of time. That data allowed us to calulcate the permeance and porosity. The first time we did it, we had the u-tube standing vertically and our numbers all came out lower than the image values. We then tried to place the u-tube horizontally thinking that gravity applied some resistance and our numbers came out better.
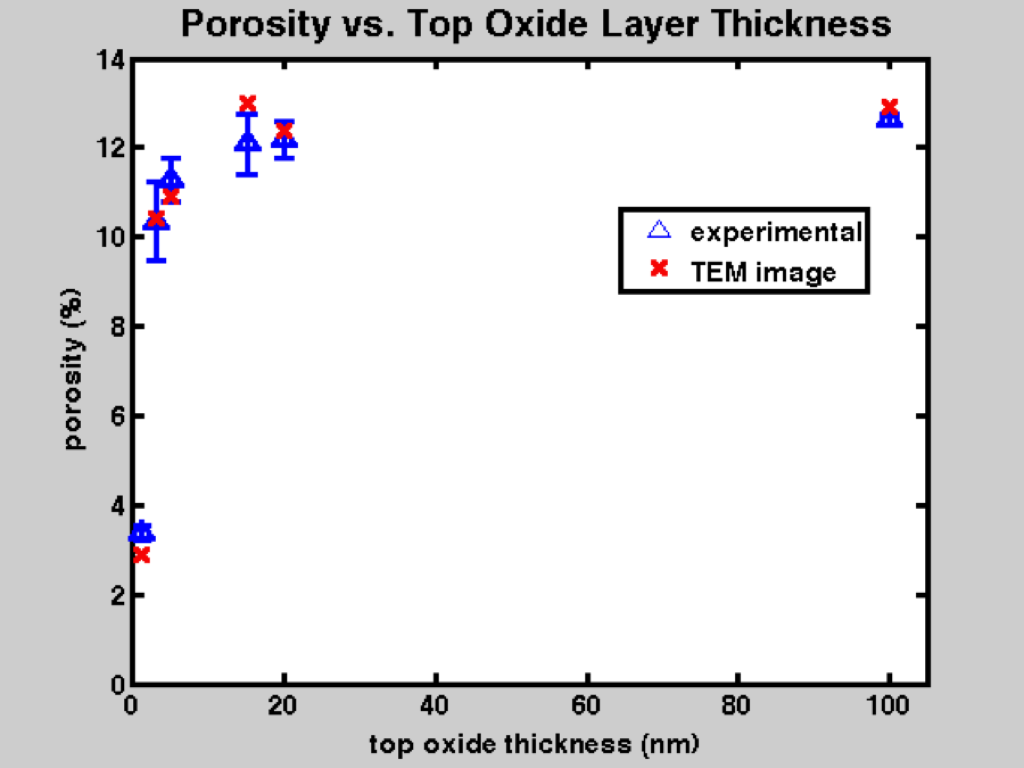
Figure 1 : Porosity versus top oxide thickness
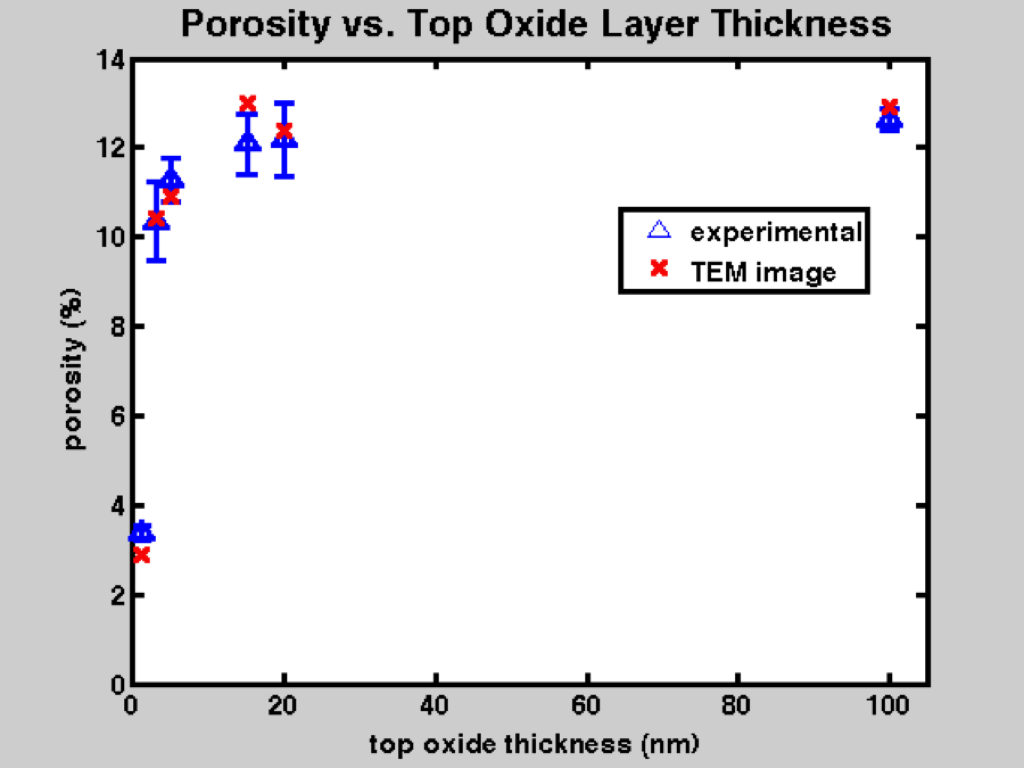
Figure 1 shows that at lower top oxide thicknesses, the change in the thickness greatly affects the porosity however, at larger thicknesses the porosity seems to stay pretty constant at around 13%. Next we tested the affect of the bottom oxide layer thickness on porosity.
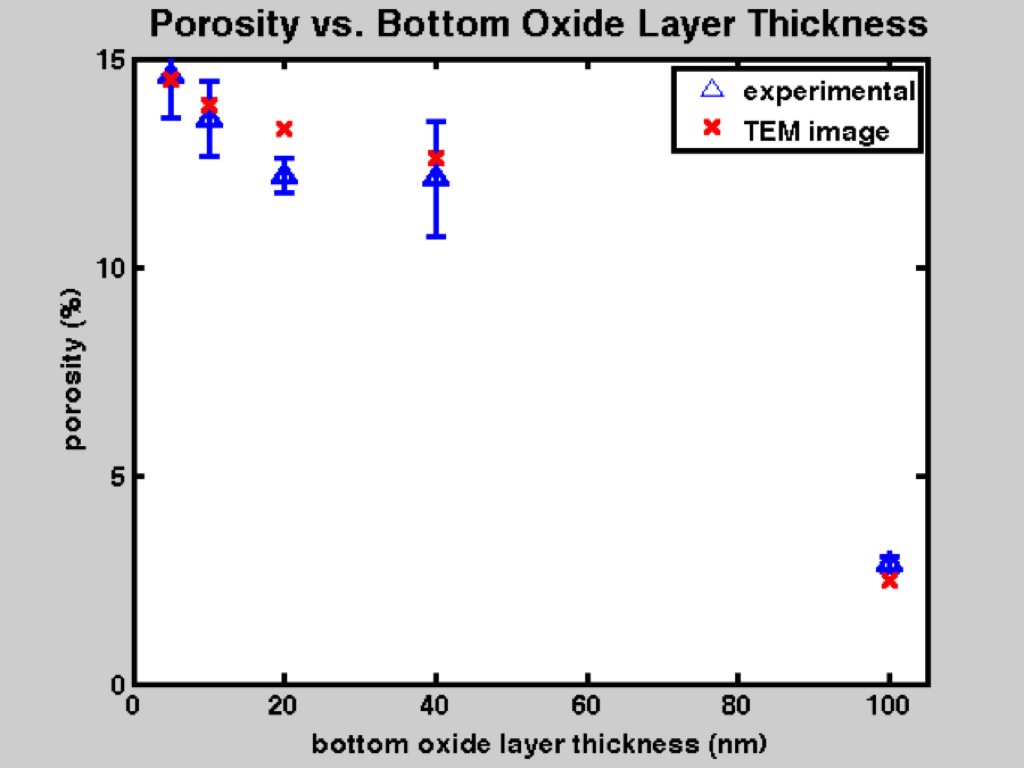
Figure 2: Porosity versus bottom oxide thickness
Figure 2 shows that at lower bottom oxide thicknesses the porosity is higher. Figures 1 and 2 show how similar the experimental values are to the image values. Therefore, we can safely acknowledge that the image values are true.
Next we measured the burst pressure of the membranes. The setup involved simply attaching a tube from the nitrogen tank to the block that holds the sample. We increased the pressure slowly until the membrane broke. When the membrane breaks you can hear it make a sort of cracking noise and you can also hear the gas flow through the membrane freely. We first measured the burst pressure of samples with different bottom oxide thicknesses.
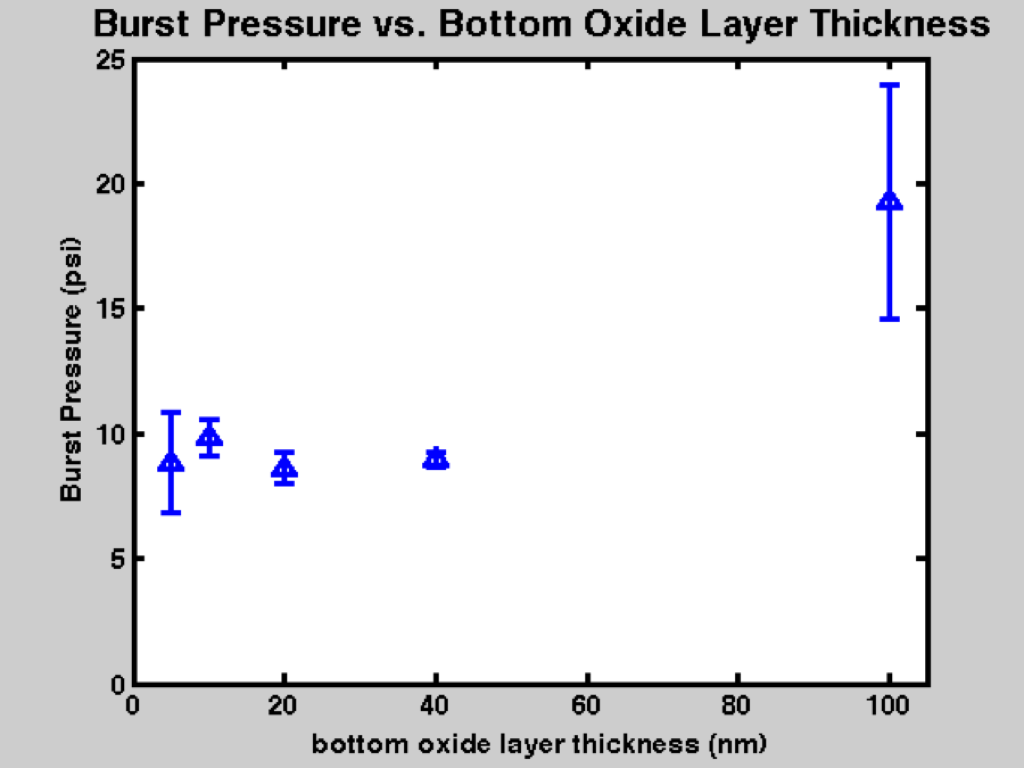
Figure 3: Burst pressure versus bottom oxide thickness
Figure 3 shows that the burst pressure of the sample stays pretty constant at bottom oxide thicknesses from 1 to 40 nm but then increases after that. Next we measured the burst pressure of samples with different top oxide layer thicknesses.
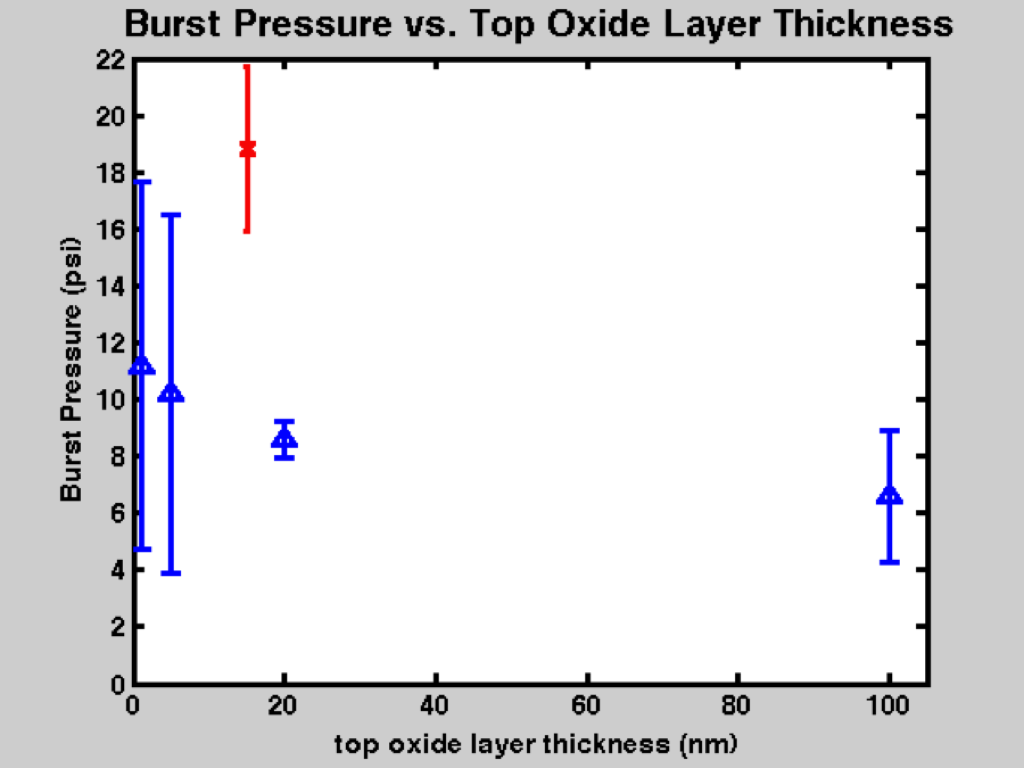
Figure 4: Burst pressure versus top oxide thickness
The red x in figure 4 represents the sample with a top oxide thickness of 15. We used samples that contain 9 windows where 8 of the windows were 100um x 100um and the 9th window was 350um x 100um. All the samples we used were designed like in that manner except the samples with a top oxide layer thickness of 15nm. That sample was just a double slit with only 2 longer windows. Those samples seem to have a higher burst pressure than the other samples. Ignoring the red x , Figure 4 shows that the burst pressure decreases as the thickness of the top oxide layer increases. So it seems as though there is an inverse relationship between porosity and burst pressure. At higher porosities, the burst pressure is lower and at lower porosities, the burst pressure is higher.
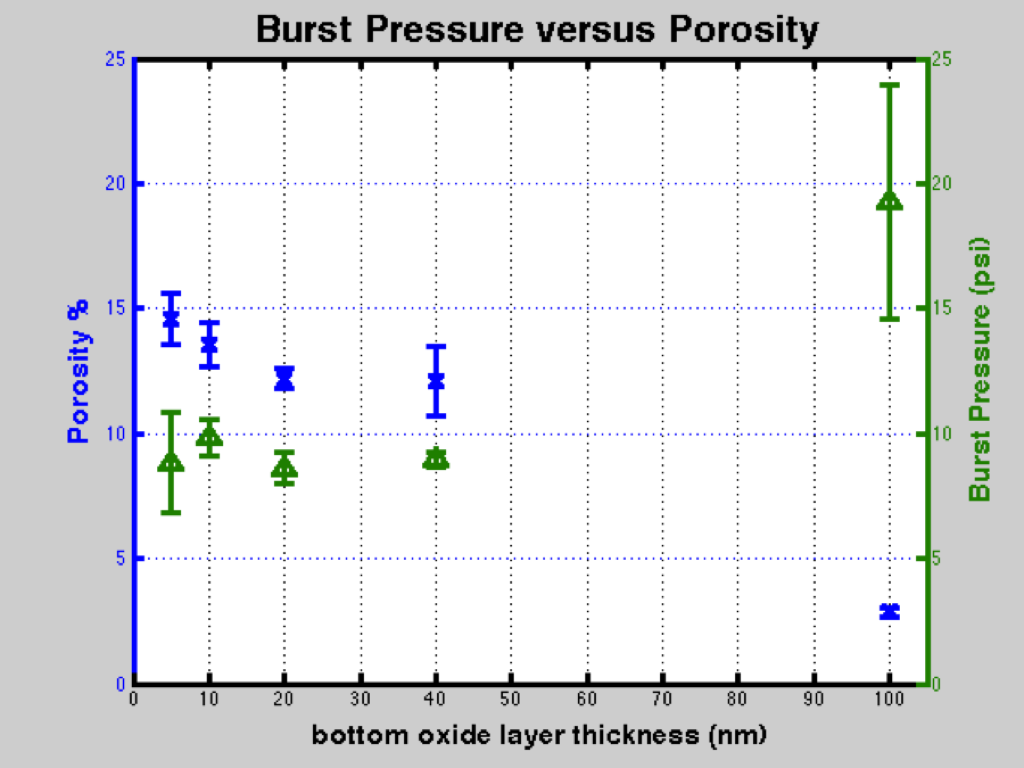
Figure 5: Burst Pressure versus Porosity for the change in bottom oxide layer thickness
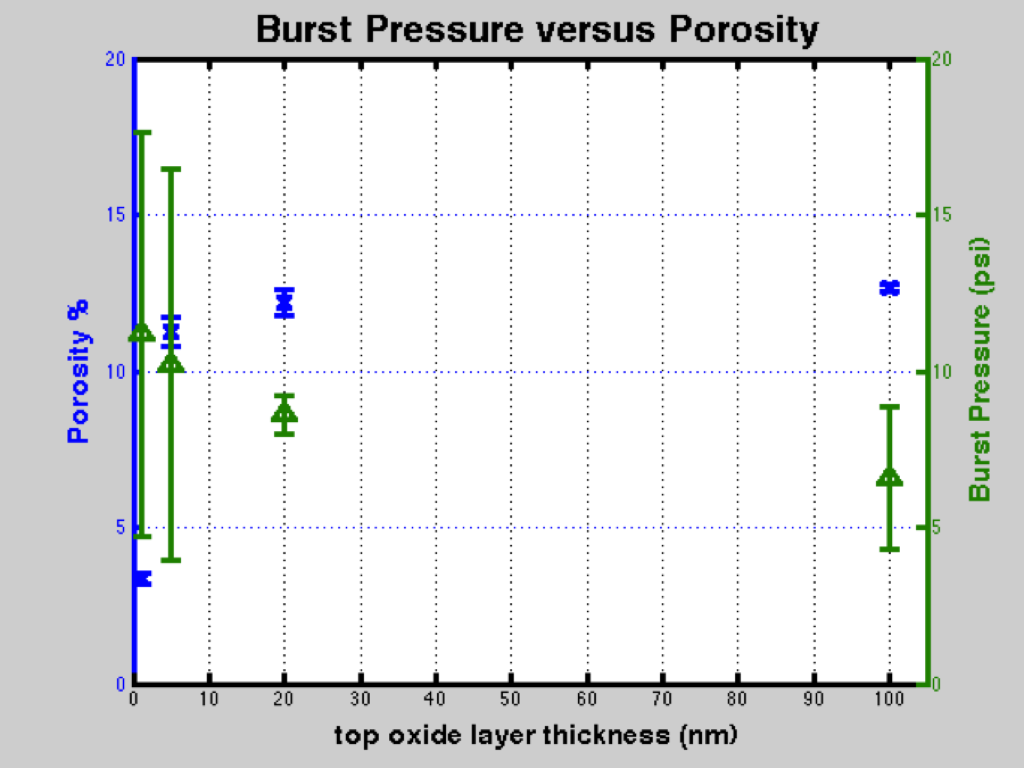
Figure 6: Burst Pressure versus Porosity for the change in top oxide layer thickness
It can be seen the pores in the membrane have something to do with the breaking point of the membrane. I tested an amorphous sample which is just a non-crystalline sample with no porosity. I found the mean burst pressure to be 27.36 psi. That measurement further tells us that the burst pressure of the membrane is linked to the porosity of the membrane.