Barcikowski Particles Revisited
The following are TECAN spectrum of the filtrates (and a spectrum of unconjugated peptide) for a series of sequential separations performed on the Barcikowski peptide (CE12W) using 10, 20, and 30nm cutoff Sepcons performed last weekend. Note that all of this data was taken with the quartz cuvette not inserted fully into the TECAN as detailed in this post, and that I excluded the two ‘phantom’ curves I reported there.
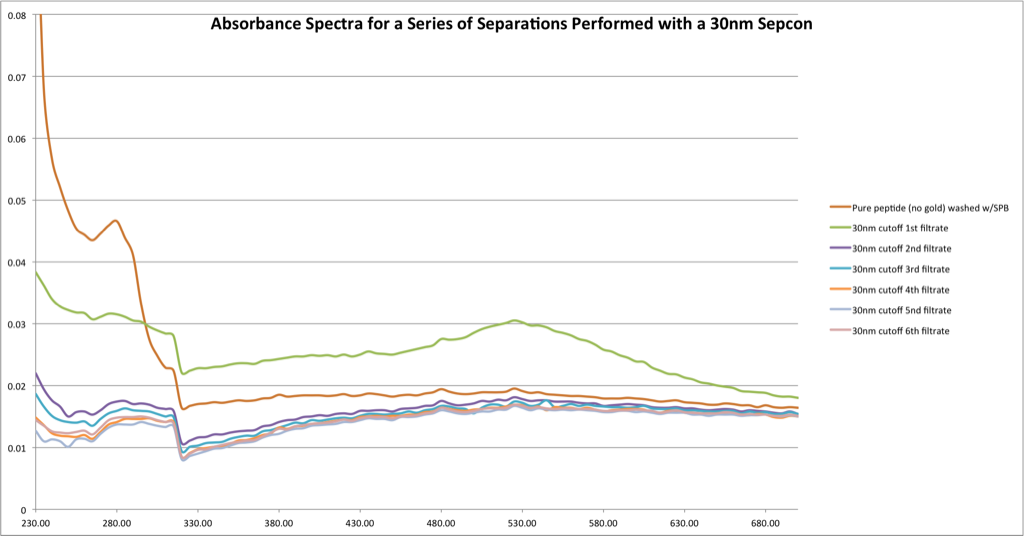
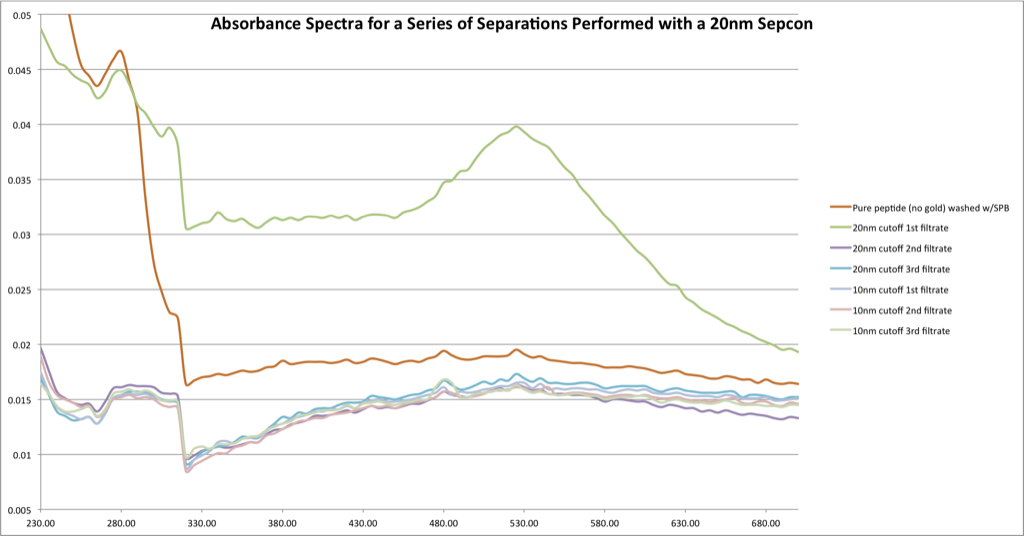
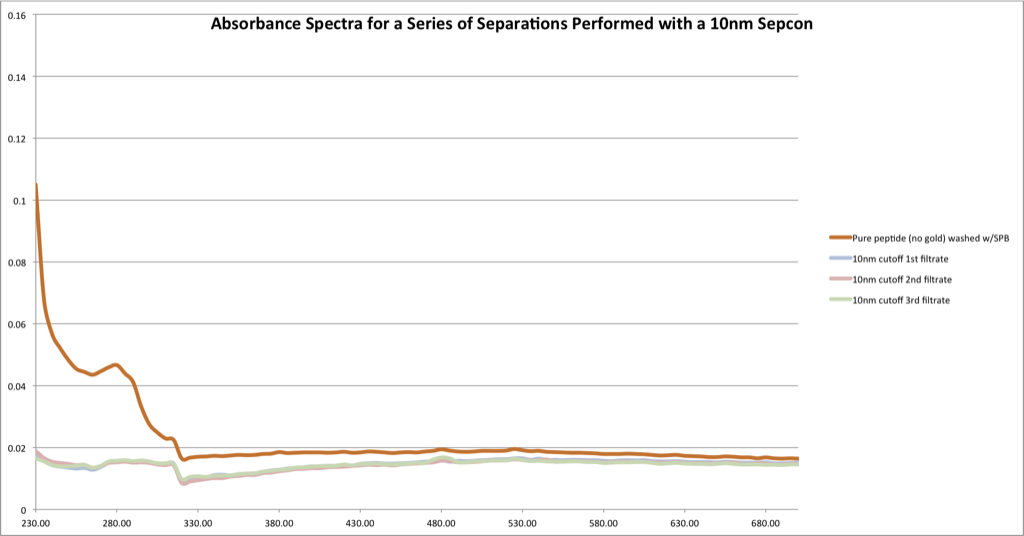
It does look like there is something in each of the first filtrates, which are shown together below:
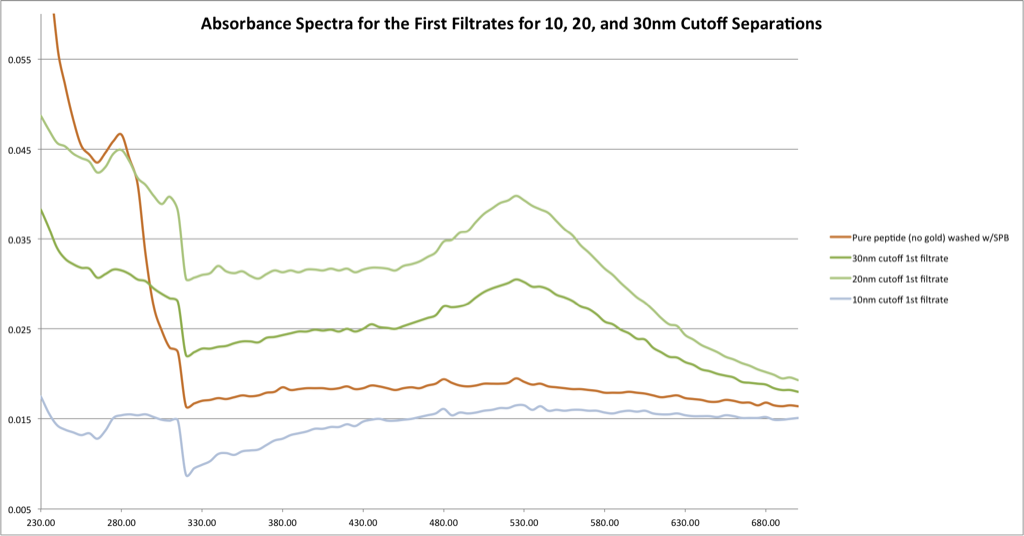
Below I have plotted the raw absorbance at 280 nm.
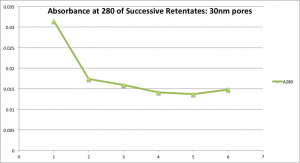
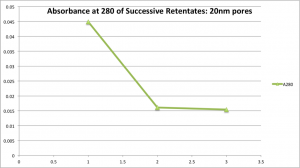
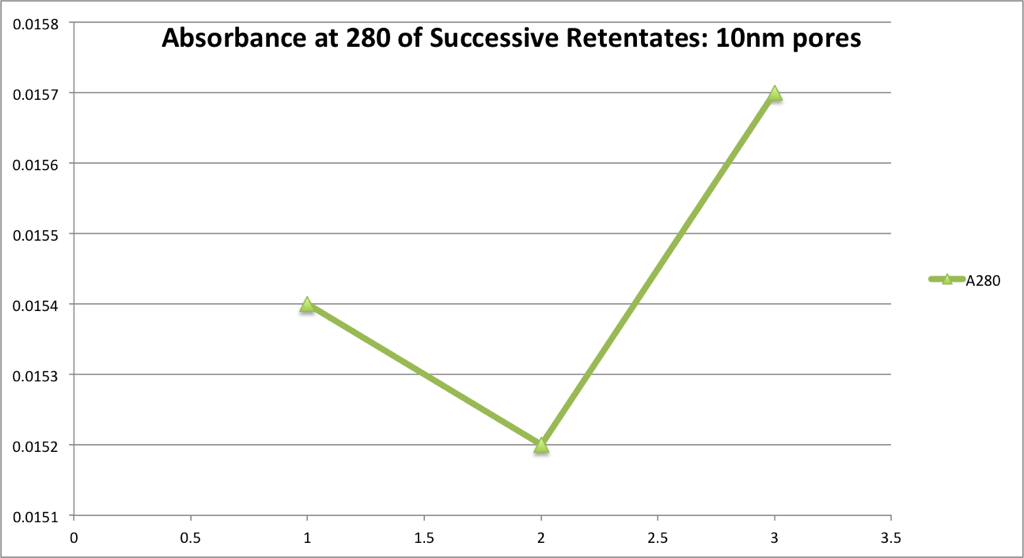
EDIT: Take a peak down at the Sepcon prep in the Methods section down at the end – I used buffer to prep the 10nm sepcons, but water to prep the 20 and 30nm sepcons, and that could be the reason we don’t see anything in the first filtrate of 10nm)
So it looks like peptide is going through the 20nm and 30nm sepcons, but not the 10nm ones.
Just in case you thought all that made sense, there’s another little wrinkle. Below are the same graphs, but I used a different measure for protein concentration – (Absorbance at 280/Absorbance at 260 – 1) :
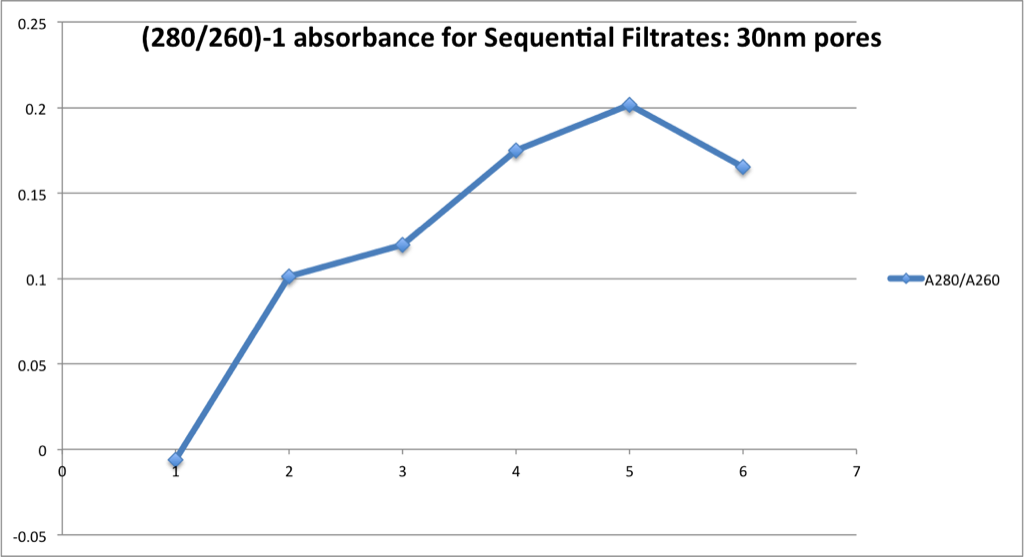
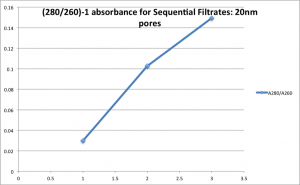
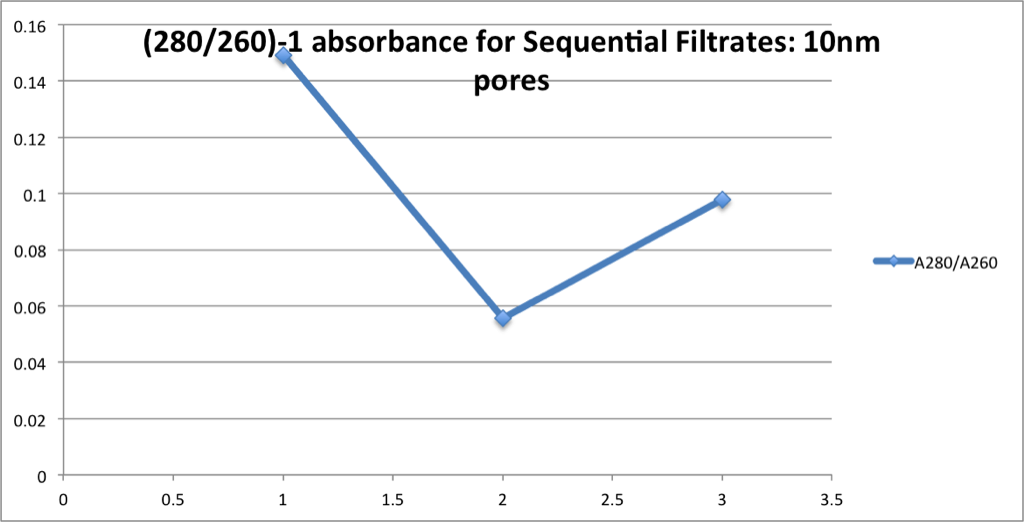
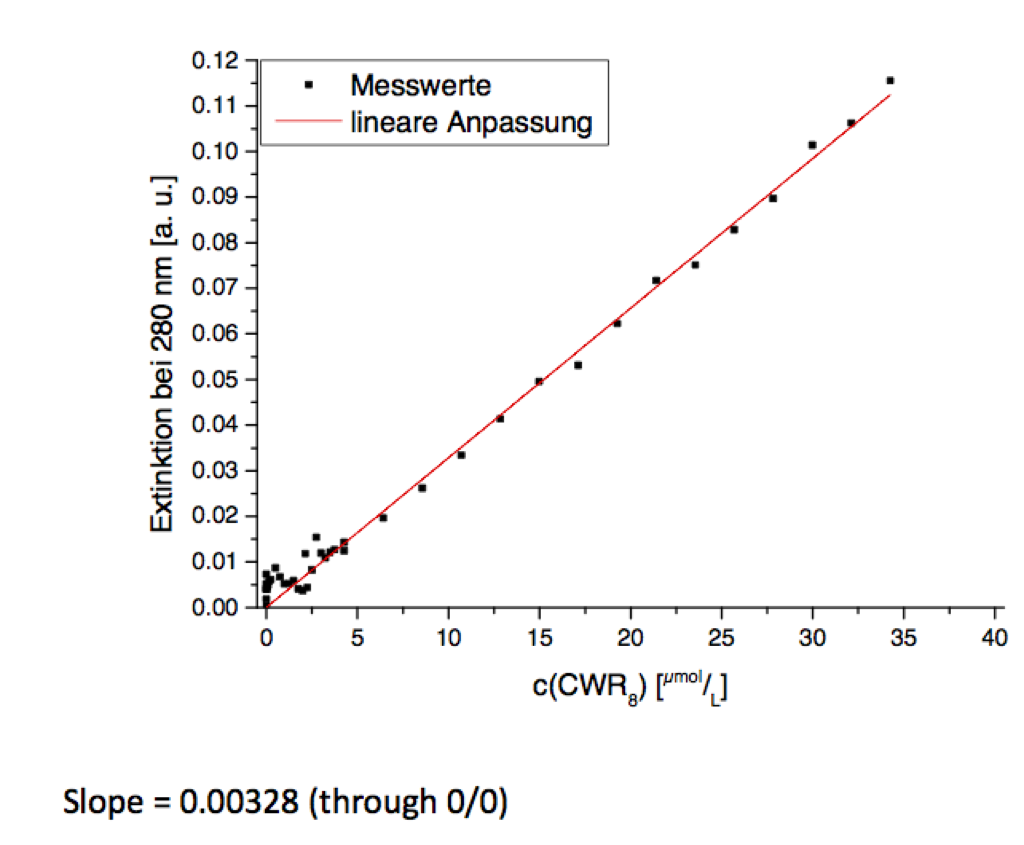
My guess for this is that our buffer (which is 0.3mM sodium phosphate buffer, just like what the Barcikowski group told me they were using) is driving this difference. Note that after each spin/separation I refilled the top chamber with an amount of sodium phosphate buffer equal to the amount lost to the filtrate. They use absorbance at 280 in all the data they’ve sent me, including this representative standard curve of unconjugated peptide (note that the peptide is a little different, with the formula CWR(8) instead of CE(12)W):
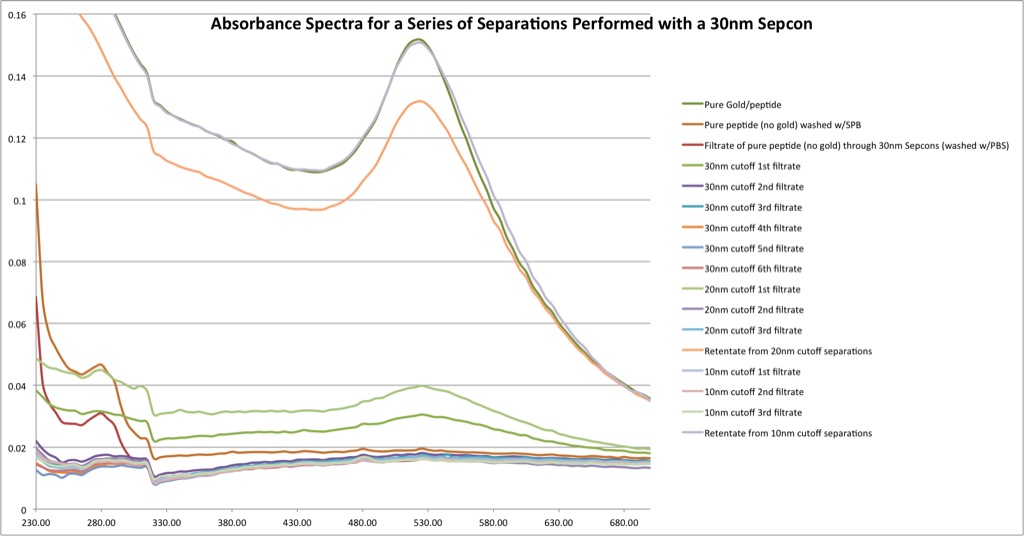
So what happens to the retentates after the sequential separations? Unfortunately I broke the 30nm Sepcon I had been using just before getting a sample from it’s retentate, but below are the retentates from the 10nm and 20nm separations, along with the pure gold/peptide sample:
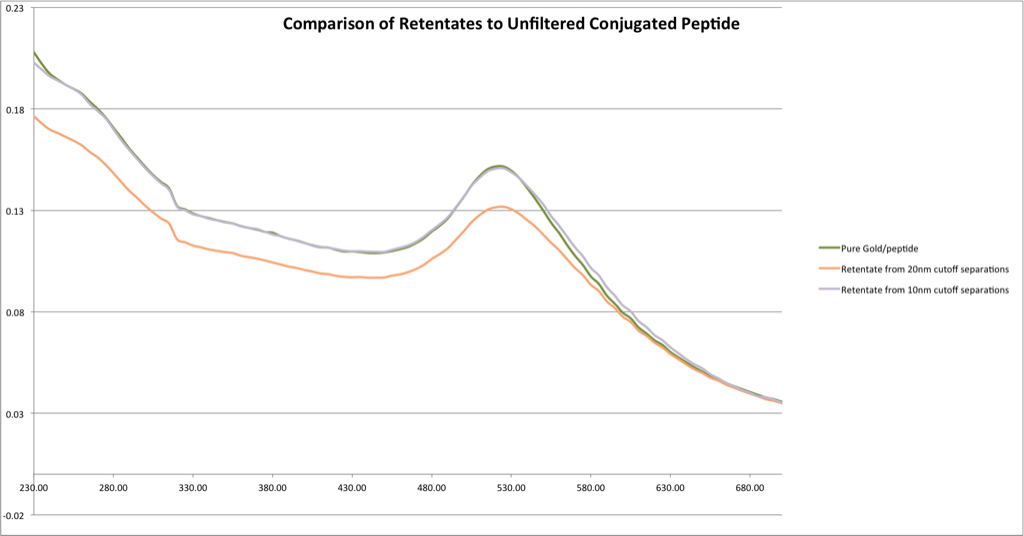
It makes sense that the 10nm retentate is identical to the unfiltered sample, since it sure seems like nothing gets through those membranes. It’s awful hard to draw conclusions about the 20nm retentate though. I’m really rather upset that I broke the 30nm Sepcon before getting it’s filtrate – that would have been the most interesting data point.
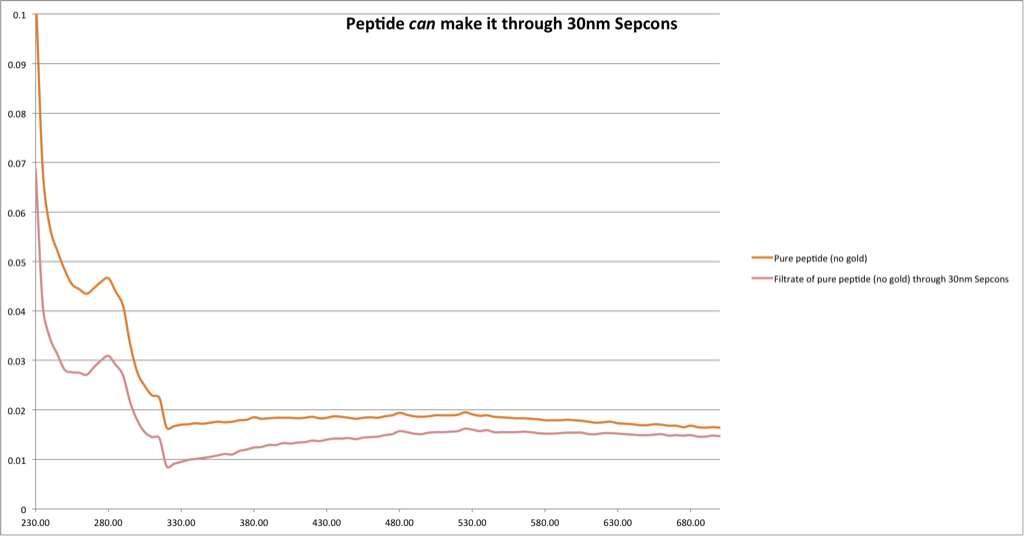
A second separation I performed on the unconjugated peptide stock they sent us seems to show that the peptide is getting through the membrane:
All of this may turn out to be moot, however, because I sent all of the filtrates to be analysed by Mass Spec. in the Proteomics Center in the KMRB. Initial results (and they are still working on it) seem to show that the peptide has degraded. Below is the text of his email:
CEEEEECEEEEEECEEEEEEECEEEEEEEECEEEEEEEEECEEEEEEEEEE
These peptides were shipped slowly and at room temperature (over our repeated protestations), and it may be that while our samples sat on the warm desk of some overworked German customs clerk all hope of a coherent picture of how we can use pnc-Si to clean up this particular sample was lost to entropy. More on that when the full results come in, though.
As one final figure, here’s all of the curves from the first four graphs plotted on one plot.
METHODS:
Sepcon Prep:
The 20 and 30nm Sepcons were wetted and tested with H20; the 10nm Sepcons with 0.3mM sodium phosphate. I had an idea that this was affecting my samples, but I ultimately came to the conclusion this didn’t matter. Typing this out now I’m not so sure – it could possibly be the reason we don’t see anything in the first filtrate of the 10nm sample. Each Sepcon was loaded with 400uL of buffer or H20 and spun in the centrifuge long enough to verify that the membranes were not broken.
Separations:
The 10nm Sepcons were spun at 2500rpm, the 20nm Sepcons at 3000, and the 30nm Sepcons at 2000rpm. Spin times varied dramatically (from between 4minutes for the first spin for 20nm to 30minutes for the last spin for the 10nm), and were chosen so that I collected approximately 50uL of sample (as determined by weight). An aliquot of buffer with the same weight as the filtrate was added after each spin to the retentate and the retentate was then agitated by filling and voiding the pipette several times.
Cleaning:
The cuvette was washed with water, then 0.01M HCl, then water, then 0.01M KOH, then water. At one point I worried that small amounts of water were causing the Barcikowski peptide to denature or something (it was late and I was tired), so for the 10nm separations I replaced the water washes with sodium phosphate buffer washes – this had no effect. The cuvette is then loaded with between 50 and 70 microliters of sample and gingerly inserted into the cuvette arm on the TECAN so that the little quartz window aligns with the laser aperture.
Are we surprised that some gold seems to be getting through the filters? Are these monodisperse or a mixture of sizes? Can you remind us of the particle size?
There is a odd cliff in all your curves around 300 nm that could be related to the TECAN switching between a UV source and a visible source. I don’t recall seeing this before and its not a good thing.
Are the retentates you show the final retentates after all the washes? If so we are cleaning up the sample with the 20 nm membranes. There are some things to work out still, but it looks like progress.
I have too many questions for a blog comment, but there are a number of things that don’t make sense to me here, so maybe I just don’t understand the experiments.
At a high level though, why are we even talking about peptides degrading? These are effectively just small molecules, not proteins with tertiary structure that can fall apart. You should be able to practically boil these things and not do them harm, right? Simply shipping them in a less-than-frozen state should not break them apart. If they are in pieces, they were most certainly shipped that way, due to a flawed prep or poor purification or they are riddled with enzymes that are cleaving them. I think we need to ask ourselves how much proteomic work we want to do for the B-ski lab to troubleshoot their own problems. If we are really interested in separating gold NPs from peptides, why don’t we just buy our own stuff, mix it ourselves, and make some pretty curves. Can’t you just buy peptides with a lot of tryptophan in them so absorbance characterization is much easier? If we are going to study separations, the feedstock has to be a 100% certainty, otherwise we’ll just keep going in circles.
In the email from Hagen, where is the tryptophan? Kindof important if you are basing all this on 280nm measurements? Also, what is the basis of this (280/260 – 1) business? Are you trying to study the ratio of W to C or something? If you are just trying to quantitate the amount of protein, the physical basis of this representation escapes me.
Thanks.