Fluorosphere separations with SiN-NP SEPCONS
Karl and I attempted once again to filter particles with the SiN-NP 5 slot SEPCON chips. (wafer # 1019, 27% porosity, avg. pore dia. – 54 nm in the center, 30%, 61 nm at the perimeter, histograms below)


We started trying to first pass 20 nm red fluorospheres, then block 100 nm yellow fluorospheres, and finally pass 20 nm red fluorospheres. Both particles came at 2 mg/mL. We diluted them to 100:1 volume ratio, then attempted to pellet out the particles by spinning for 15 min at 25 krpm in the OPTIMA Ultracentrifuge in the TLA 55 holder. The 100 nm fluorospheres pelleted while the 20 nm did not. We removed the supernatant and resuspended the 100 nm particles and left the 20 nm particle solution as is. We then further diluted the solutions to 1000:1 volume ratio in water.
Using 300 µL in the top of the SEPCON and wetting the bottom with 12 µL, we initially tried to centrifuge at 2 krpm but had very little pass (~12 µL?) even after 10 minutes. We increased to 3 krpm and passed ~100 µL after 15 min.
We used the TECAN and the fluorescent microscope to try to detect fluorospheres in the filtrate. I ran initial baseline scans for both “red” and “yellow” wavelengths but didn’t actually subtract them below because the signal was so low and consistent across wells.
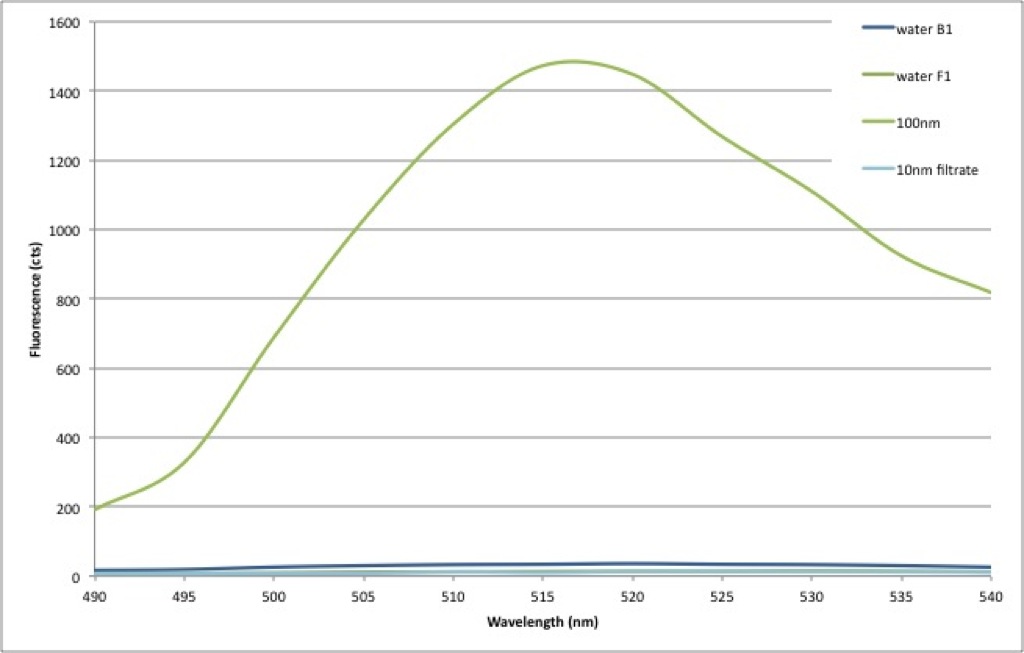
The following plot shows a TECAN scan exciting at 450 nm. It shows a relatively strong fluorescence for the stock solution of 100 nm particles, but no fluorescence from the filtrate. So 100 nm fluorospheres are not passing through the membrane. Alas….
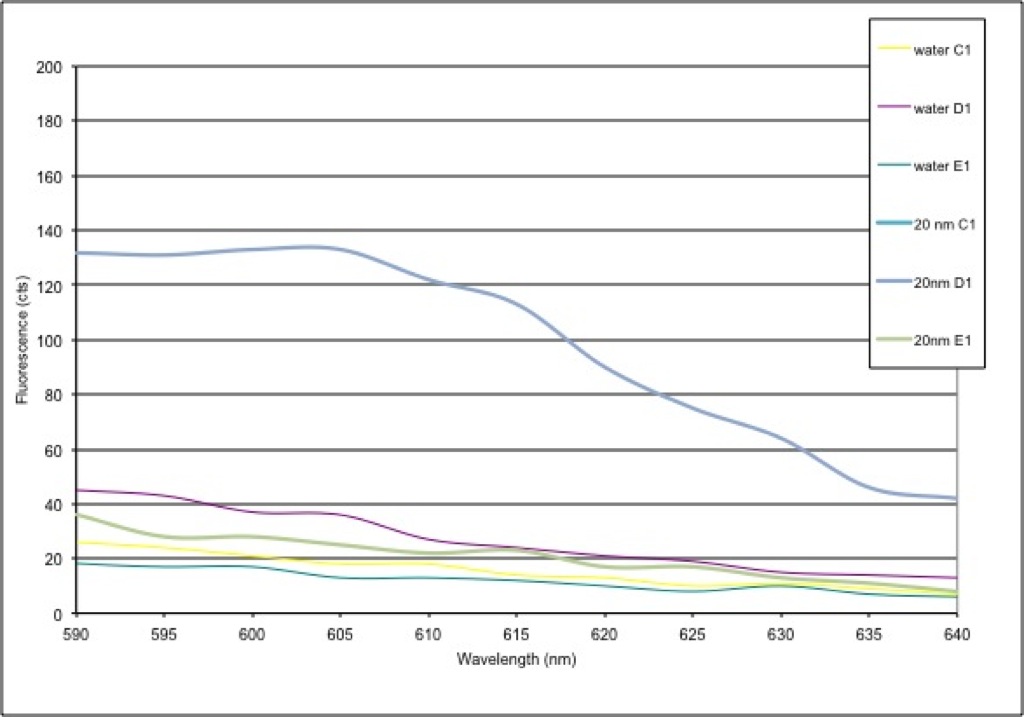
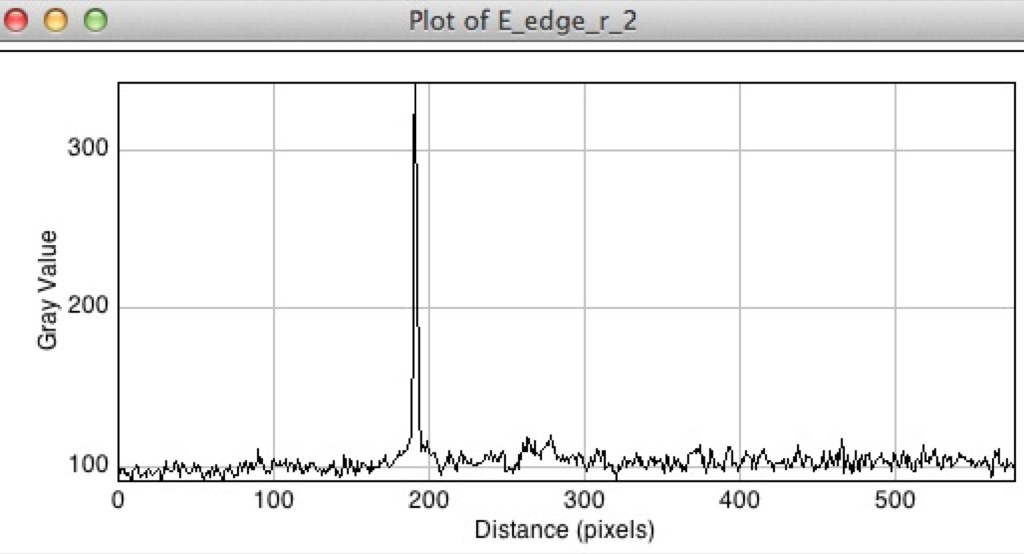
In the next two plots we show the results of the TECAN scans for the 20 nm red fluorospheres excited with 540 nm. The strong peak is the stock solution and the rest of the lines are from the 1st and 2nd filtrate, before and after the 100 nm’s were attempted. So according to this, neither 20 nm , nor 100 nm fluorospheres are passing. (I show a closeup on the low signal lines to show that there is a slight increase for one of the filtrates, but it is so low in comparison to the stock that I effectively consider it no signal)

As mentioned, we tried verifying the TECAN measurements with fluorescent microscope images. I washed slides and coverslips with ethanol and used 1 µL of solution. We used the “FITC” filter to look at the 100 nm fluorospheres (Exposure-100 ms, Gain-10) and the “Rhodamine” filter to look at the 20 nm fluorospheres(Exposure-100 ms, Gain-2).

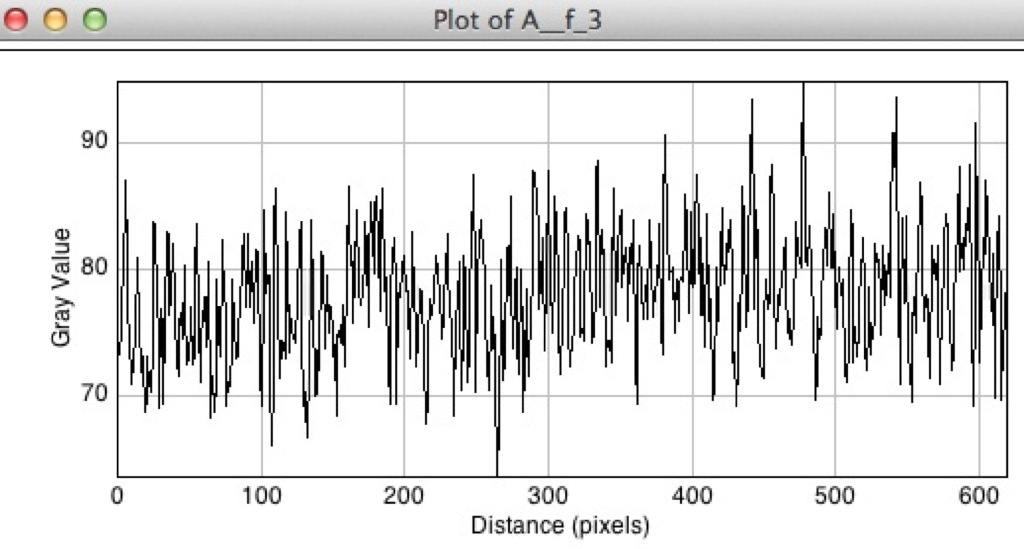

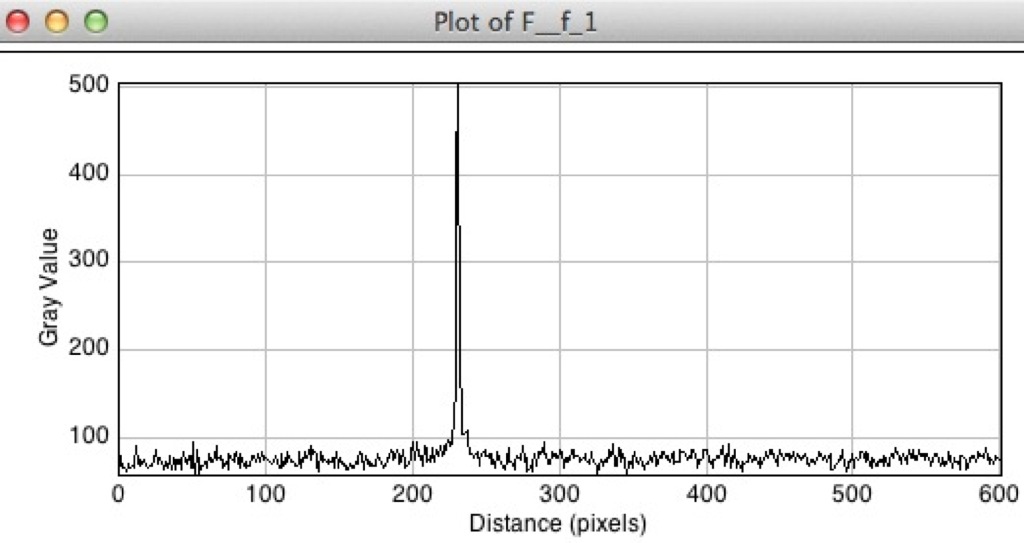
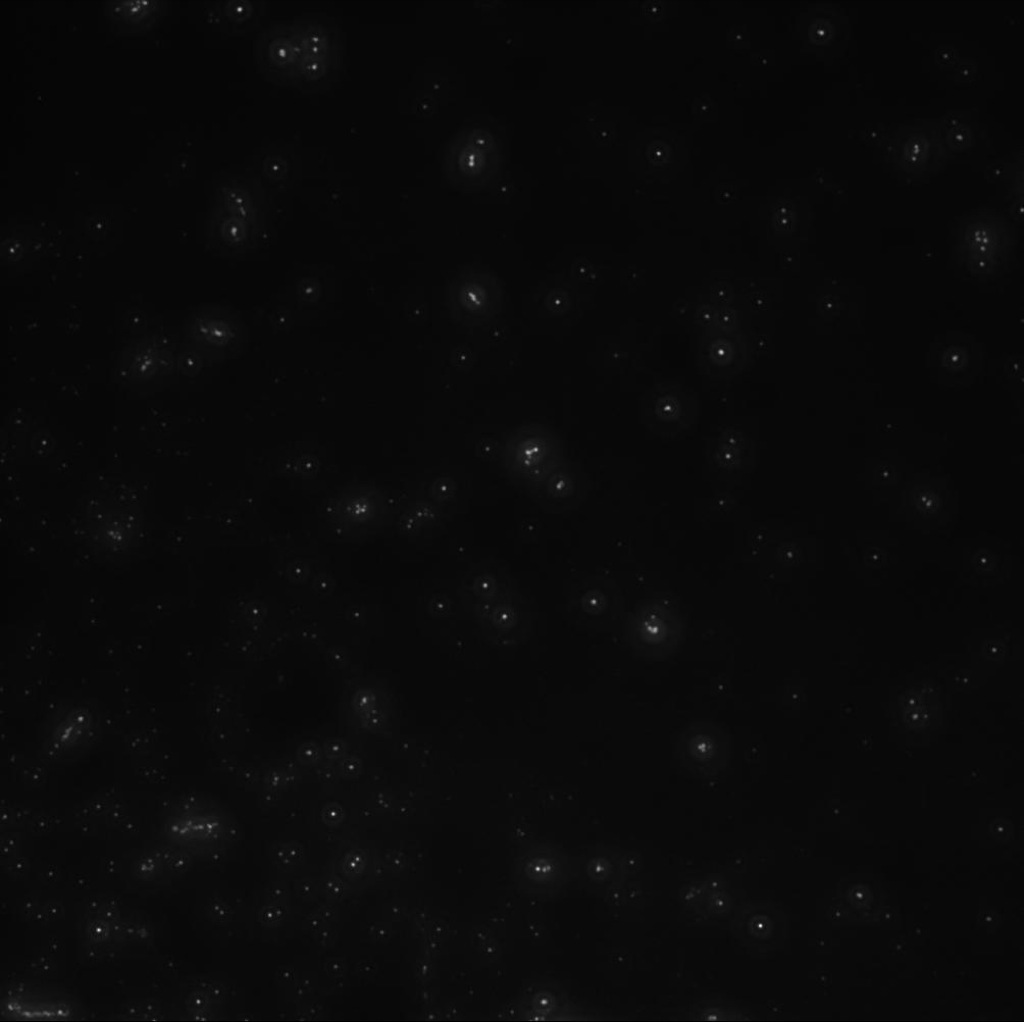
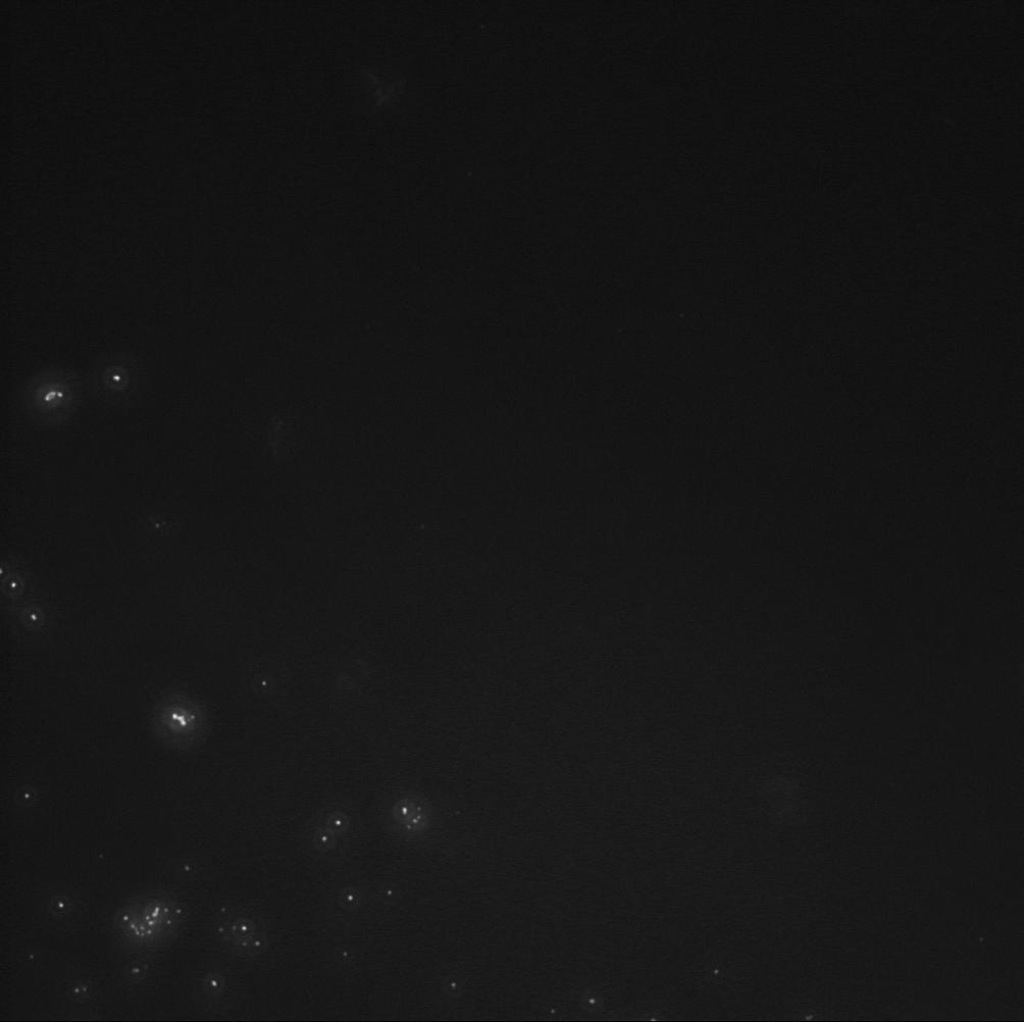
While the 100 nm fluorospheres were fairly consistent in that I could find several of them per viewing field, I saw very little evidence of the 20 nm fluorospheres in the field. The following images show the fluid front and the quick drop off in particles as you move towards the center.
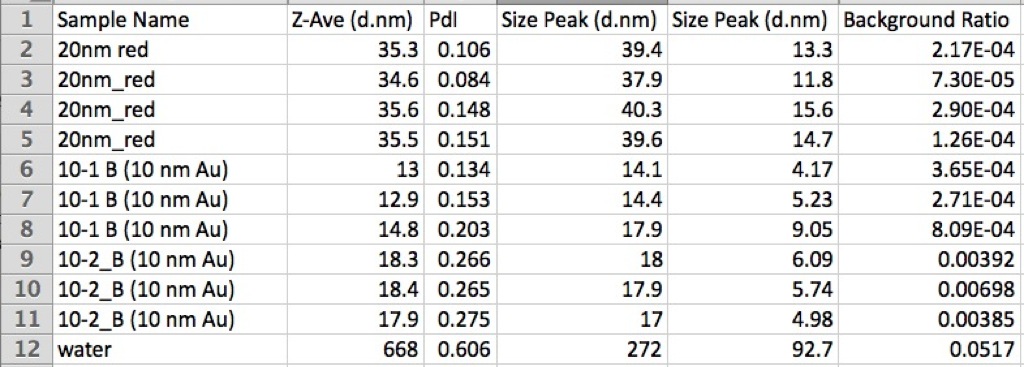
I would be tempted to say that not finding 20 nm fluorospheres in the field with the microscope indicates that there is something wrong with our 20 nm stock, but I’m afraid it is more likely that something with my technique is flawed. To gain more confidence in the 20 nm fluorospheres, we also did a particle size analysis using the malvern. Here’s a table showing results for 20 nm fluorospheres and 10 nm Au NPs. Honestly, I’m not even sure how to interpret the values provided, but in general is looks like the fluorospheres are at least smaller than 40 nm. (I included all of the data in the summary because I don’t know if the PDL or the background ratio gives us a degree of confidence. I need to read up on all of this…)
Not passing 20 nm fluorospheres through a membrane with an average pore size of 54 nm was disconcerting at the time, so we decided to try smaller particles. We don’t have smaller fluorospheres, but we do have Au NPs. We diluted 10 nm Au NPs by adding 4:1 volume water:Au. (I couldn’t find an initial concentration labeled on the bottle, but Karl said this worked well for him in the past so I ran with it) The plot below shows the absorbance results using the cuvette in the TECAN. Gold passed through the exact same membranes that had blocked the fluorospheres in the tests above.

I discussed the above results with Jim and Chris and they both pointed out that diluting the fluorospheres in water would lead to an effective radius due to charge much greater than that of the physical fluorosphere. In lieu to reading up on that phenomenon and truly understanding it, I just diluted our initial 100:1 solutions of 20 and 100 nm fluorospheres with 1X PBS in a 10:1 ratio. (So I mixed 1000 µL of 1X PBS with 100 µL of 100:1 aqueous fluorosphere solution) I assume that’s sufficient?
Well I won’t keep you in suspense, I did the same experiment as above with new membranes and neither the 20 nm nor the 100 nm fluorospheres passed, even in PBS.
Just for the heck of it, I did the same dilution detailed above but replaced 1X PBS with 10X PBS. Still no 20 nm fluorospheres passed.
So what now you ask? Great question!
The good news is that I am much more confident using the current wavelength and gain (150) settings on the TECAN and using the 1000:1 dilutions of fluorospheres. I’m also getting a better feel of the flow rates expected out of the SiN-NP SEPCONs. We have not had a problem getting the filters to pass fluid. (possibly due to the high humidity?)
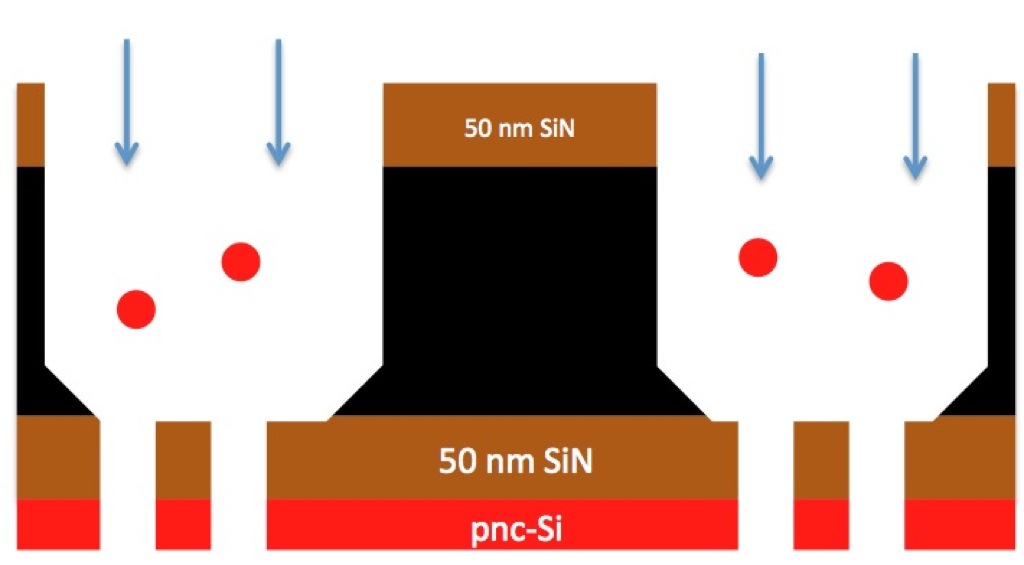
So I think we just need to find a way to pass 20 nm fluorospheres, or come up with a good explanation as to why they shouldn’t be passing. Hopefully someone sees a flaw in my work up above that can be easily remedied. Below is a schematic showing the direction of flow for the fluorospheres “through” the filters. We’ve discussed the possible implications of have the dual-layer of pnc-Si on SiN. Perhaps that is adding to our woes? I could try flipping the chips to flow past the pnc-Si first, but I hesitate to do that until I have a pretty good reason to do it. JP has also stripped the pnc-Si from some chips and I could try separations with them to see if there is any difference.
Are your concentrations in range? Its very easy to dilute particles to the point where you see nothing – especially easy to do in the microscope. You could probably do these separations without any dilution of the sample because nanoparticle stocks are not really that concentrated on a number basis.
You checked that the ‘stock’ solutions gave good signals in the TECAN. Does this mean the processed, diluted samples still had strong signal (diluted 100:1 and then 1000:1 for a 10^5 fold dilution) or the actual stock from the fridge had good signal?
You guys should make serial dilutions of nanoparticles from the real stock and prepare thin microscope samples to find the sweet spot for nanoparticle observation. It will be a different sweet spot for the 20 nm and 100 nm because the former are ~100 fold more abundant.
The ‘stock’ solution referred to in the plots is the diluted fluorospheres, not directly from the bottle. Sorry for the poor word choice.
To clarify, the dilution is a total of 1000:1, so ~10^3 fold dilution. (We did a 100:1 and then a 10:1, for a total of 1000:1)
I like using as low a concentration as possible to reduce the possibility of clogging and stretching the fluorospheres, but there may be benefits to using higher concentrations that I haven’t thought of. (We used 10:1 dilutions in the past and actually saw particles settle into and fill up the trenches of the chips.)
Karl had us do serial dilutions in the past, but I agree we should do them again now that we’re a little more familiar with the TECAN. We did not look at the serial dilutions in the microscope and that would be a great thing to do to establish a reference for what to expect.
Thanks!
So the images that you claim have no 20 nm fluorescent particles clearly have many 20 nm fluorescent particles. Are you saying these are in the dry portion of the coverslip and not the fluid volume? The particles will stick to bare glass and will collect at liquid/air boundaries if there is any motion/evaporation. The few 100 nm that get through are probably not really 100 nm (particle stock is not mono disperse). The 20 nm are severely hindered, but are getting through. This does me wonder about pore blockage or cake formation. In that case lower concentrations might help get better results.
Here is the calculation from a student in a class showing how the molarity of gold particles varies with size. Repeating this for polystyrene and calculating the number expected in the field of view of the scope might be enlightening. Also do the polystyrene separations at the same concentrations that worked for gold.
The fluorescence microscope images provided above are from the initial prepared 1000:1 dilution of 20 nm and 100 nm particles. This was not the sample passed through the membrane. I was expecting to see 20 nm fluorospheres in the fluid volume, and not just at the interface between the of air and fluid. I was able to see a few 100 nm particles in each viewing field as a scanned around the microscope slide, but there were no 20 nm fluorospheres visible, unless I was at the interface of the air and the fluid.
I prepared the slides perhaps as much as one hour before viewing them. If the particles are collecting at the fluid front as you suggest, then I should have looked immediately after preparation. I’ll do that next time. Maybe the 100 nm fluorospheres are visible around the entire microscope slide because they are more likely to get stuck in between the slide and coverslip?
I only looked a couple of filtrate samples and because I wasn’t able to see anything in the center of the slide, I stopped preparing samples and focussed on the TECAN data only.
I’ll post a better reply to the particle concentration when I finally get to the serial dilution study, but according to the supplier, there should be ~100 times more 20 nm fluorospheres than 100 nm fluorospheres in a given volume. So all things being equal, we should see a lot more 20 nm fluorospheres on a microscope slide. Again, maybe this is mostly due to me waiting too long after slide preparation and actually looking at the sample.