FLAG Diffusion Experiment Progress Update
For context, see my previous post.
Early on in the process of designing an experiment to confirm the usefulness of a CytoVu assembly for use as an assay, it was decided that the best solution for measuring the extremely low concentrations [ng/mL scale] of bacterial alkaline phosphatase (“bAP”) in the filtrate which would indicate what had occurred in the retentate would be a fluorometric assay containing fluorescein diphosphate (“FDP”). This is predicated on a simple reaction of bAP dephosphorylating FDP, releasing free fluorescein into solution and increasing the fluorescence for measurement.
The initial incarnation of this type of measurement followed rigidly the instructions of a kit designed for this purpose; sample from filtrate and known concentration solutions into well plate well, add FDP solution, wait 15-30 minutes, measure all wells once, compare samples against standard curve. For a few months I performed experiments and attempted to nudge the system into compliance, using this system of measurement as my only confirmation of success or failure. Somewhere during this time, I ran out of the FDP stock solution supplied in the kit, and rather than ordering an entirely new kit, I opted to simply order solid FDP and mix it myself. Standard curves continued to appear nicely linear after this change, and so I continued on the same path.
Unfortunately, the results simply made no sense. Often, solutions would apparently have more bAP in them than was at all possible by significant amounts, and relationships between samples were occasionally counter-intuitive. I decided to investigate this — something I now see I should have done from the very beginning, but live and learn — by running a kinetic experiment with the TECAN on a few standard solutions. I created four solutions, in identical pairs; that is, I created two identical solutions with a known, relatively high concentration of bAP and two identical solutions containing buffer only. I then sampled each of the four solutions into two wells each, for a total of eight measurements, and rather than waiting 15-30 minutes, I immediately placed the well plate in the TECAN for measurements every three minutes for 45 minutes total, starting at t = 0. Results were surprising and a bit upsetting: the two sets of identical samples (four high bAP, four buffer only) showed hardly any trend, with one of the high concentration samples actually being near-indistinguishable from one of the zero samples. Obviously, any measurement taken like this is absolutely meaningless, let alone a measurement taken at just a single vertical slice of such a set of signals!
Since identical samples resulted in non-identical signals, it was clear that noise was extremely large in the system compared to signal. Enzymatic dephosphorylation is a 2nd order reaction, and so the rate of reaction should depend both on concentration of FDP and bAP. In an effort to eliminate as much noise as possible, I multiplied my bAP concentration by four, and reduced my FDP concentration by one half. This resulted in the following set of signals:
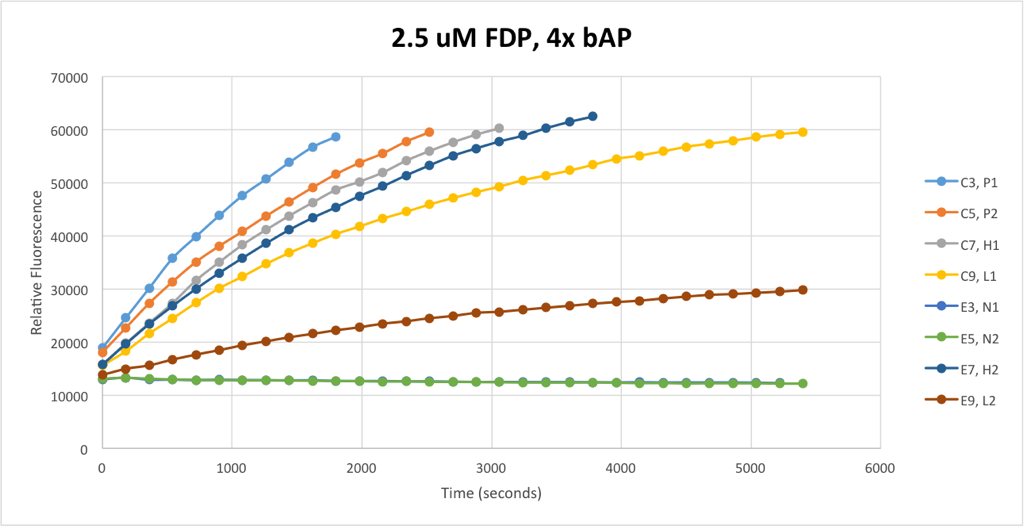
Note that the signals are in identical pairs — the two upper-most signals are from identical samples, as are the two below that and so on. This means that the yellow and red signals — L1 and L2 — are supposed to be identical. This system is considerably less noisy than the 5uM FDP system I was using before, and yet still any attempt to measure concentration of bAP by taking a vertical slice of this set of signals would be absolutely worthless for anything short of a vague qualitative analysis.
Still, noise was reduced by this method. I pursued this trend, holding my bAP concentrations constant and again halving the concentration of FDP used in the fluorometric assay:
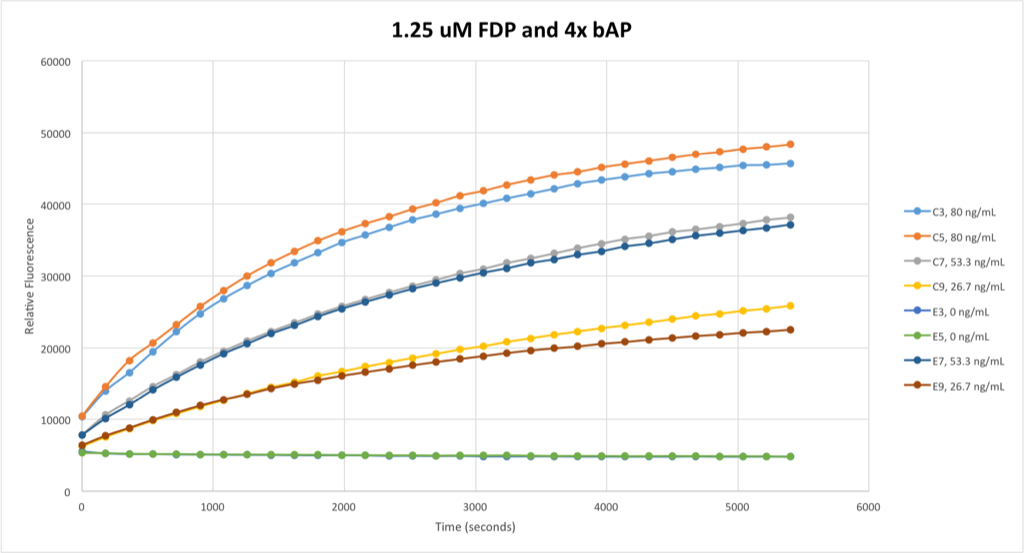
Now we’re getting somewhere. These signals are now in obvious pairs, with little divergence between them at any point. Unsurprisingly, the signals diverge more and more as time goes on, so a good time to make direct comparisons here is around t = 2000 seconds, where divergence is little but the signals have had ample time to separate from each other.
So, now that I can actually measure what I thought I could measure before, I decided to run another full diffusion experiment. I modified my experiment to include about two and a half times as much phosphatase as before, and after a ~24 hour period sampled both the filtrates and retentates of the CytoVu assemblies used. For the first time, I have clear, meaningful results that aren’t simply “it didn’t work.”
First, a recap of the diffusion experiment: Eight solutions are sampled into eight wells. A complete system contains bAP, which has Sigma’s FLAG peptide sequence bound to it, biotin-conjugate FLAG antibody, large avidin-acrylic beads in excess, and free FLAG peptide. In theory, the antibody and avidin beads bind together irreversibly thanks to the extremely favorable avidin-biotin binding reaction, and the bAP is bound to the antibodies by the FLAG sequence attached to it, preventing its diffusion from the retentate into the filtrate (as the avidin beads are huge — large enough to settle under gravity, even!) The FLAG peptide is also capable of binding to the antibody, however, and so the peptide competes with the bAP for antibody binding sites, creating a proportional relationship between the concentration of peptide in solution and the concentration of free (unbound) bAP in the solution, which is then allowed to pass into the filtrate. The eight solutions are all variations on this theory: positive control (bAP only,) negative control (no bAP,) no elution (no peptide,) 1x, 2x, and excess elution (with equal moles of peptide and antibody binding sites, twice as many moles of peptide, and excess peptide, respectively,) and 0.25:1 and 1:1 molar ratios of antibody to bAP (other systems have these in a 2:1 ratio.)
After the allotted 24 hours the experiment very clearly did not go to equilibrium, but some bAP definitely passed through the membranes in each of the cases in which it was allowed to (that is, every one except negative control.) The ratio of concentration of bAP in the retentate to bAP in the filtrate is shown here:

Note that the negative control is not included, as it returns a divide-by-zero error for obvious reasons. The 1x and 2x elution cases are also not shown, for reasons that will be discussed momentarily. The magnitudes of the bars corresponding to each system represent what I termed the “resistance to diffusion,” or perhaps more accurately, the inverse of bAP freedom. Systems with less bAP freedom (that is, more bAP-antibody bonds, thus preventing the bAP from diffusing into the filtrate) have relatively higher resistances. As is expected, the positive control system had the lowest resistance, as nothing existed in the system to prevent it from diffusing, save for the membrane itself. The no elution case had extremely high resistance, as antibody bound up the bAP and nothing was present to compete for those binding sites, preventing the bAP from diffusing with anywhere near the freedom allowed it in the positive control case. Addition of excess peptide, however, resulted in competition between bAP and peptide for antibody binding sites, and was extremely effective, resulting in nearly as much bAP freedom as the positive control system. Further, as expected, reducing the concentration of antibody with respect to bAP in turn reduced the amount that the antibody was capable of binding up the bAP, increasing relative bAP freedom (or, decreasing resistance.)
1x and 2x elution cases are not depicted because, bluntly put, they did not work. Both cases had very high resistance to diffusion, characteristic of systems with no peptide at all. I hypothesize that this is in fact because there was effectively no peptide at all in solution. The peptide was frozen for several months, thawed with heat, diluted, and only then sampled into the systems. The excess peptide case, on the other hand, was not diluted and had a concentration roughly an order of magnitude higher, as well as several times more volume of peptide added. I believe that the concentration of peptide I had attempted to add to the 1x and 2x systems was in fact considerably lower than desired, and so it had a negligible effect. The extreme effectiveness of excess peptide, however, still serves to confirm our understanding of the system.
In order to tie this project up, I want to wait considerably longer before sampling the system. Diffusion through a membrane follows a decaying exponential trend, and I appear to have waited not quite a single time constant (time to 63% of final value) of the positive control system, seeing as the filtrate got to ~53% of its anticipated final value. Exponentially decaying systems go to equilibrium (or extremely close, that is) after five time constants, and so I should wait about five days if I want the least resistive system to go to equilibrium.
In order to run another set of experiments, I’ll need to make more CyotVu’s, this time with the new nanoporous silicon nitride (how exciting!) and so that will take a few days. Between that and the long duration of the next experiment (I may not wait the full five days, but it will still be long,) I expect I’ll have more to say about this experiment in about two weeks. Until then, hooray for more baby steps!